
Figure 5.
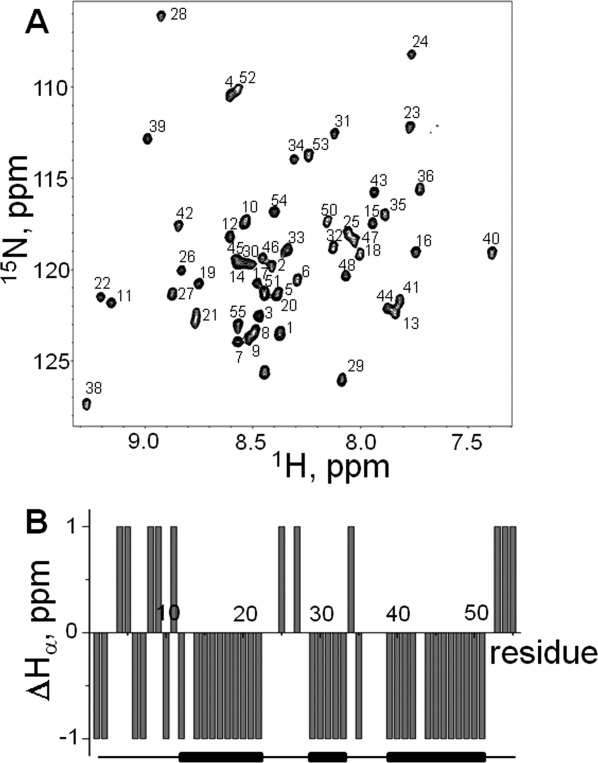
A: Assigned [15N,1H]-HSQC spectrum of the PAI subdomain from the DNA-binding domain of SB transposase. The spectrum was recorded at 5°C in 25 mM sodium phosphate buffer at pH 7.0. B: The chemical shift index (CSI)26 obtained using Hα chemical shifts of PAI subdomain. Stretches of random coil (0) and helices (−1) are shown below the graph.