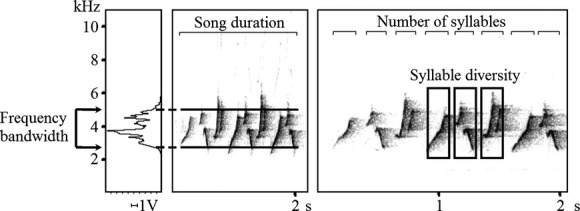
Figure 1.

Spectrograms from a song of Geothlypis rostrata, illustrating song measurements. Frequency bandwidth was calculated from measurements of maximum and minimum song frequency (frequencies at which the sound amplitude drops 17 dB below the song peak amplitude) on the power spectrum of song (left panel: amplitude in volts, by frequency in kilohertz). Song duration was measured on spectrograms (middle panel: time in seconds, by frequency in kilohertz), and total number of syllables (to calculate syllable rate) and number of different syllable per song were counted on spectrograms with higher time resolution (right panel; in this example, 8 syllables and 3 different syllables).
