Figure A1.

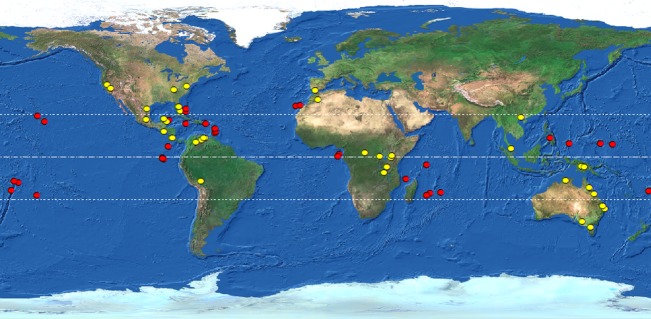
Geographical locations for the recordings of each insular (in red) and mainland species (in yellow; mainland locations are the mean for the different recordings of each species). Dashed lines mark the equator and the tropics.

Geographical locations for the recordings of each insular (in red) and mainland species (in yellow; mainland locations are the mean for the different recordings of each species). Dashed lines mark the equator and the tropics.