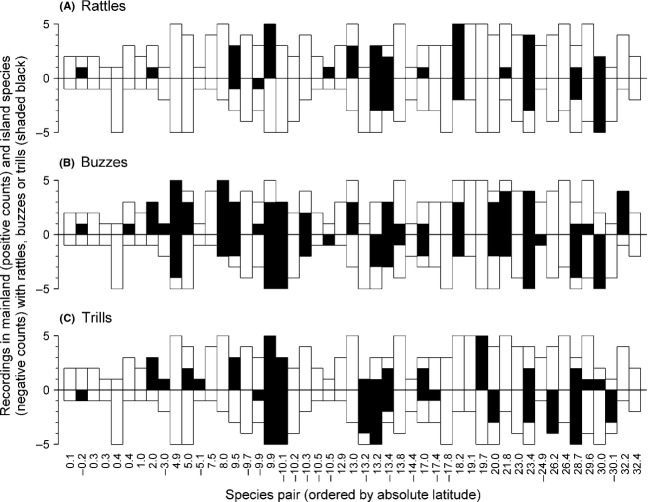
Figure A2.
Number of song recordings with (A) rattles, (B) buzzes, and (C) trills in paired mainland and island species (black bars), also showing the total number of recordings per species (black plus white bars). Mean latitude for each species pair is indicated below the horizontal axis (southern latitudes as negative values).

