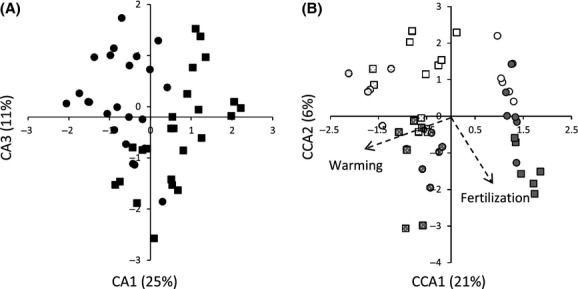
Figure 3.

Differences in the phospholipid fatty acid analysis profiles of (A) the O (circles) and E (squares) soil horizons and (B) for the different treatments shown by soil samples scores along different canonical axes of the constrained canonical analysis (CCA). (A) O and E horizons were discriminated along the first and third nonconstrained axes, while (B) significant effect of the fertilization and warming treatments (P < 0.05) were revealed along the two constrained axes by discrimination of sample scores from the control-irrigated soils (I, white), warmed-control-irrigated (WI, white-dotted), fertilized-irrigated (FI, gray), and combined warmed and fertilized-irrigated (WFI, gray-dotted) treatments, respectively.
