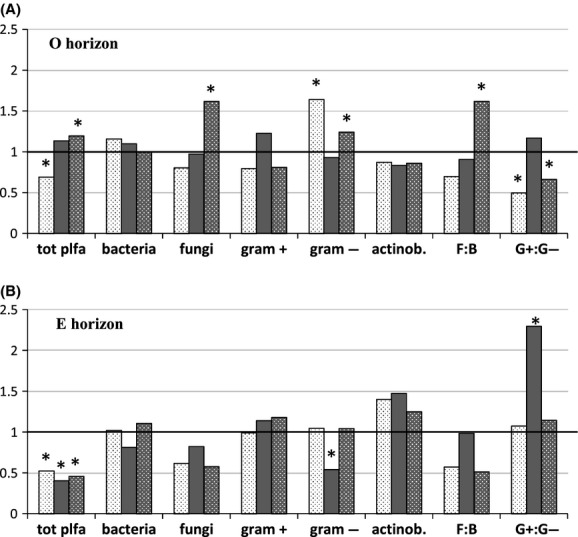
Figure 4.

Ratios and abundances of main microbial groups in the warmed-control-irrigated (WI, white-dotted), fertilized-irrigated (FI, gray), and combined warmed and fertilized-irrigated (WFI, gray-dotted) treatments relative to the control-irrigated treatment (I; black line) for (A) the O horizon and (B) the E (below) horizon, respectively. *indicates significant differences (P < 0.05) between the control and one of the other treatments, respectively.
