
Figure 5.
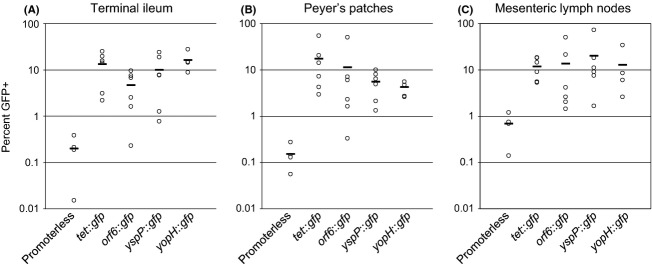
Quantification of 48-h infection results. To objectively analyze the data generated by flow cytometry, the number of bacteria in the gated region (GFP+) was compared to the total number of bacteria present in the samples based on plate counts (Total) to calculate the percentage of GFP+ bacteria. Open circles represent the results from a single mouse, in the tissue indicated; the bar depicts the average of all mice. Each strain was compared to the promoterless control, using the Mann–Whitney U-test. All results were found to be statistically significant, with P-values of ≤0.02. (A) Terminal ileum (B) Peyer's patches (C) Mesenteric lymph nodes.