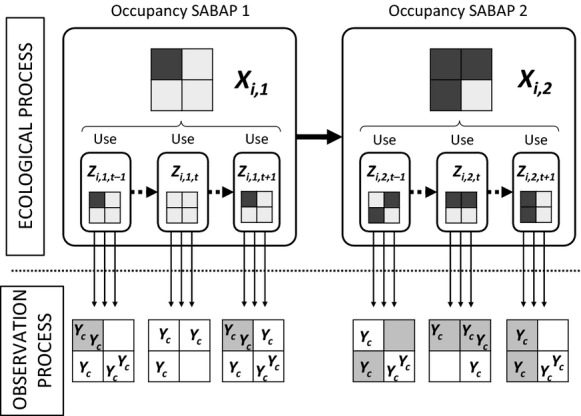
Figure 1.

Model diagram representing the relationship between the three hierarchical levels of occupancy Xi,s, use Zi,s,t, and observation Yc. The four-cell grid represents a simple spatial lattice where the species of interest can either be present (dark cells) or absent (white cells) within the time period of interest (SABAP or year depending on the temporal scale). The plain horizontal arrow represents the dynamic processes of cell persistence and colonization between SABAPs. Dashed horizontal arrows indicate dynamic processes of exploitation and appropriation within each SABAP. As illustrated, the number of checklists collected varies between cells and years.
