Figure 6.

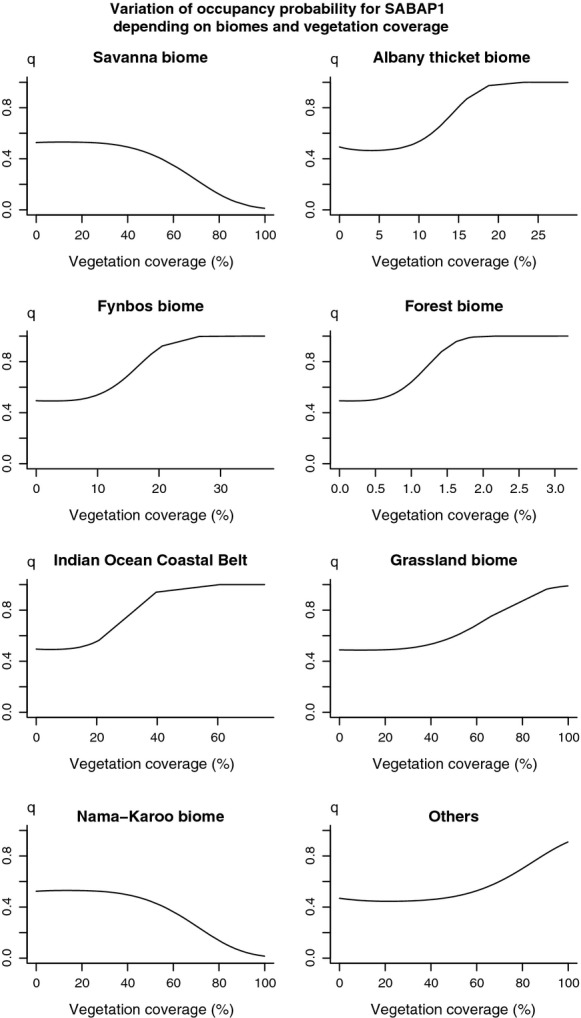
Estimated relationship between hadeda occupancy probability during SABAP1 and habitat covariates. The habitat covariates were the percentage of each cell's area that was covered by each vegetation types.

Estimated relationship between hadeda occupancy probability during SABAP1 and habitat covariates. The habitat covariates were the percentage of each cell's area that was covered by each vegetation types.