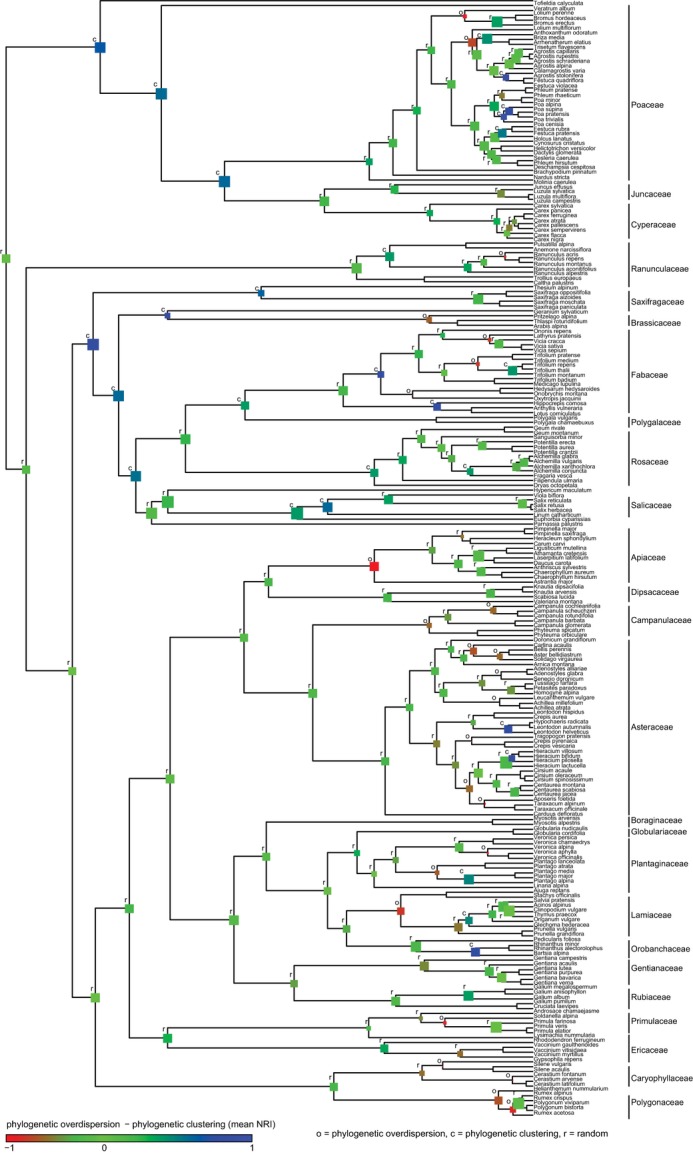
Figure 2.

Lineage-specific community assembly at 230 phylogenetic subtree nodes, the observed patterns represents the average net relatedness index of 693 local communities in the Western Swiss Alps. Phylogenetic overdispersion = red, phylogenetic clustering = blue, and no phylogenetic trend = green. The different sizes of the squares represent the standard deviation of the phylogenetic patterns from the mean. o, phylogenetic overdispersion; c, phylogenetic clustering; r, random.
