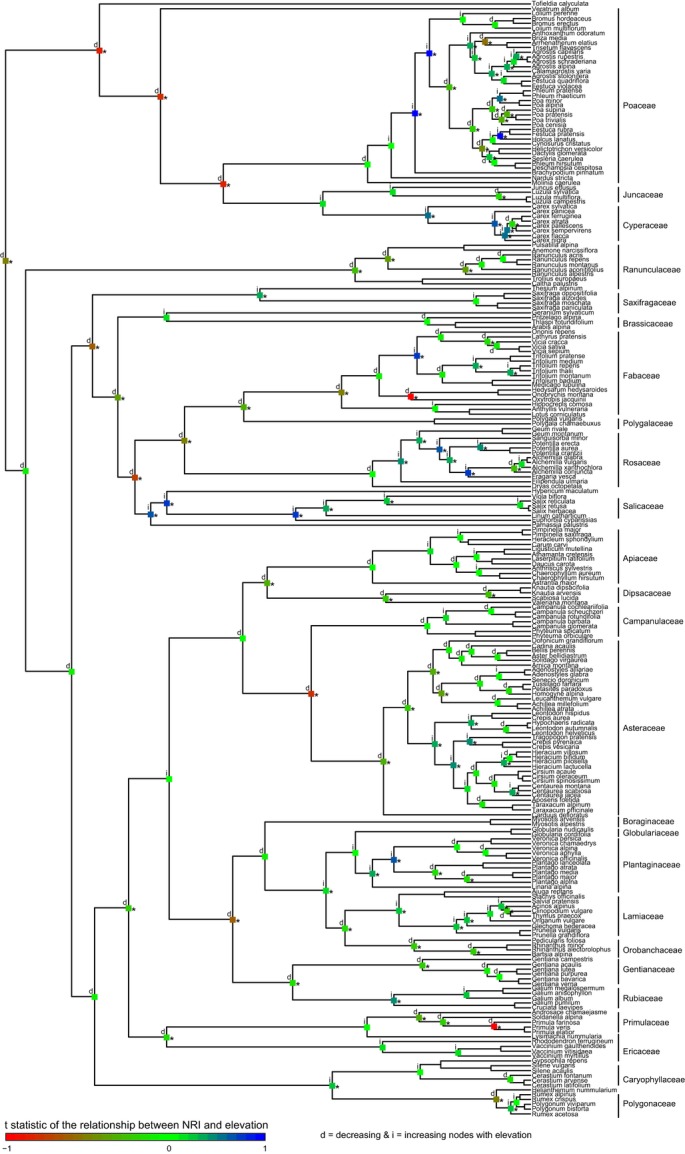
Figure 3.

The t-statistic of the relationship between net relatedness index (NRI), and elevation at phylogenetic tree nodes. The subtree nodes show a transition of NRI from decrease to increase. Decrease in NRI (red), no overall trend (green), and increase in NRI (blue) with elevation. The stars on nodes indicate a significant decrease or increase in NRI with elevation. d, decreasing; i, increasing nodes with elevation.
