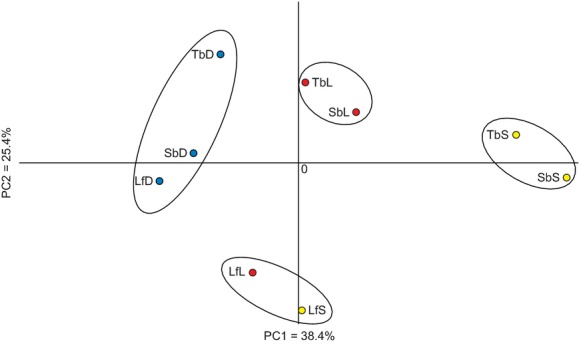
Figure 4.

Principal component analysis (PCA) plot of the genetic structuring among whitefish morphs. PC1 and PC2 explain 38.4% and 25.4% of the total variation. The proportion of inertia of both axis returned significant P values (P < 0.0001). Circles indicate population clusters as identified in the hierarchical STRUCTURE analysis (see Fig. 5). Lake-morph combinations coded as in Table 1 and colored as in Fig. 3.
