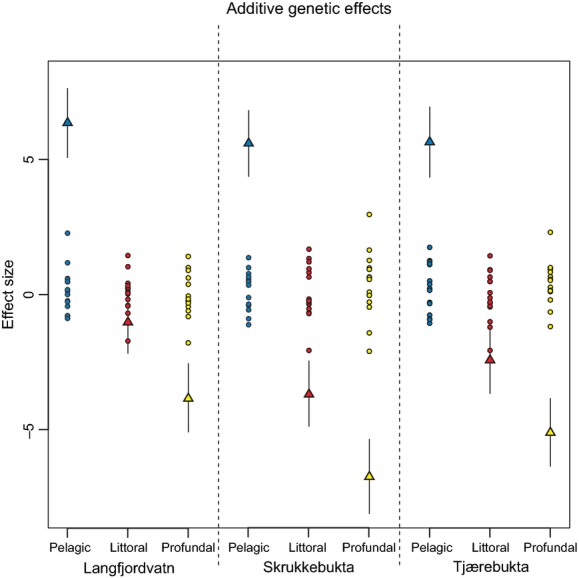
Figure 6.

Habitat effects on phenotype. The blue dots represent the pelagic habitat, red the littoral, and yellow the profundal habitats. The columns are Lakes Langfjordvatn (Lf), Skrukkebukta (Sb), and Tjærebukta (Tb). The triangular dots and the error bars represent estimates of population means from the real data (posterior median and 95% credibility interval), whereas the small dots represent the amount of variation expected for a neutral trait (15 replicates over the evolutionary process).
