
Figure 2.
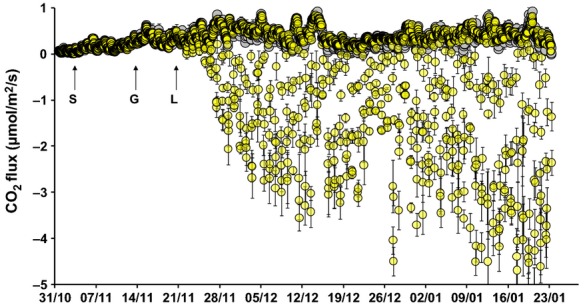
Mean CO2 fluxes ±SE (n = 6; ignoring the nonsignificant N treatment) from the opaque respiration (gray circle) and transparent NEE chambers (yellow circle) during the entire experimental period. The timings of sowing (S), germination (G), and first leaf stage (L) are indicated by arrows.