
Figure 6.
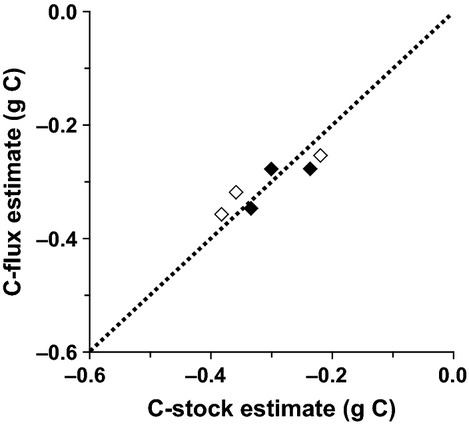
C balance of the individual chamber NEE fluxes (from the individual mesocosm collar locations; fluxes are PAR corrected, see Fig. 3 and including CDOC, see Table 1) compared with their corresponding C stock inventories. Open and closed symbols correspond to −N and +N nutrient treatments, respectively. Also shown is the 1:1 line.