
Figure 2.
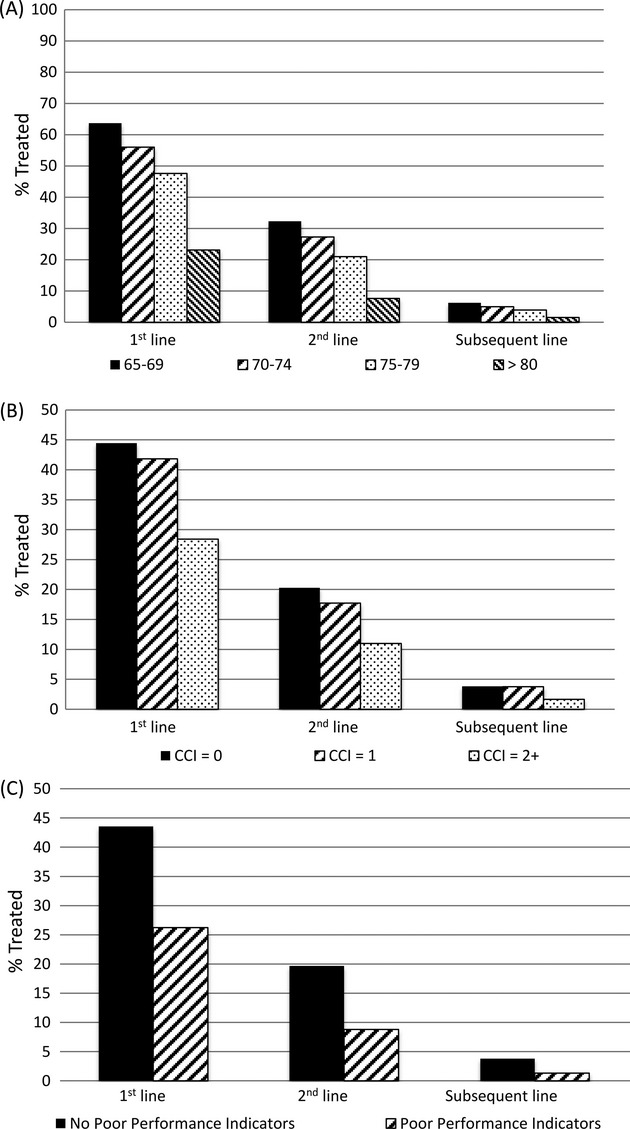
Percent of age group (panel A), Charlson comorbidity index (CCI) (panel B), and poor performance status indicators (panel C) by lines of treatment out of the entire cohort.
Official websites use .gov
A
.gov website belongs to an official
government organization in the United States.
Secure .gov websites use HTTPS
A lock (
) or https:// means you've safely
connected to the .gov website. Share sensitive
information only on official, secure websites.
Percent of age group (panel A), Charlson comorbidity index (CCI) (panel B), and poor performance status indicators (panel C) by lines of treatment out of the entire cohort.