
Figure 11. Mean-field results for increasing fluctuations.
When we consider fluctuations  in the initial loads around their average value
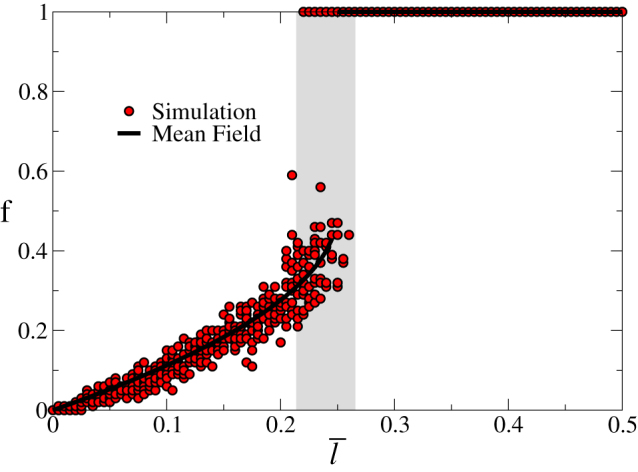
  we observe that the transition is still abrupt but can happen in a region around the mean-field predictions (corresponding to Δ = 0). Full circles: results of simulation for 1000 links systems where, for each value of
  , 10 different realizations of the disorder in the initial loads are considered. Thick line: results for the mean field case where no fluctuations are present and all the initial loads are equal to
  . The shaded area highlights the region (roughly centred around the mean field transition) where the first order transition can occur.