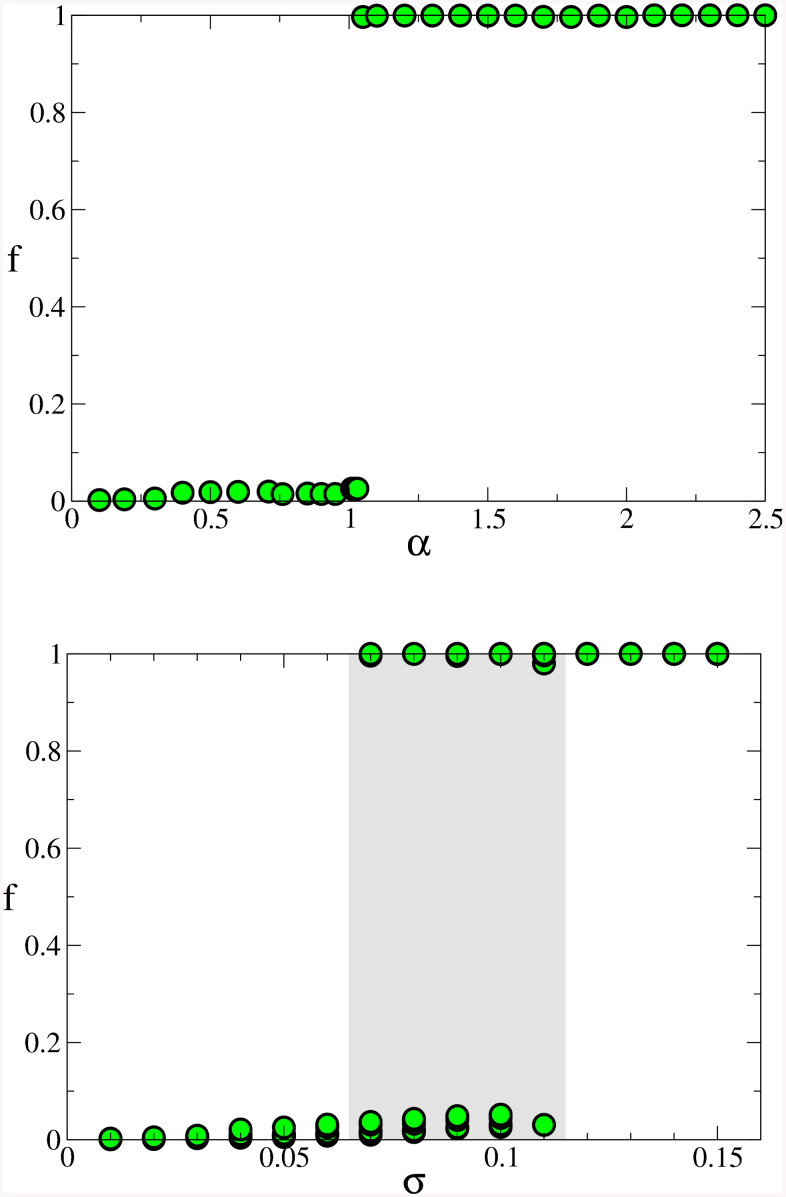
Figure 6. Cascade results for the 2746 bus Polish grid.
This network is a snapshot of the national high-voltage Polish power grid obtained from the data collected and used by Polish transmission system operators. In the upper panel we show that the fraction f of tripped lines versus the relative load increase α shows and abrupt jump typical of first order transitions; moreover, breakdowns in such a network are systemic, i.e either all the lines have failed (f ~ 1) or the grid is safe (f ~ 0). In the lower panel, by varying σ, we show the effects of the fluctuations in the loads. Data point corresponds to 10 different realizations of the noise. At difference with the case of uniform load increase, the transition does not happens at a given σ, but can happen in a whole range of values. In particular, we find that the grid stays essentially intact (f ~ 0) when the loads fluctuate less than ~6% and that the system suffers a black-out (f ~ 1) when loads fluctuate more than ~12% of their nominal values. For intermediate values (shaded region), the system can either be in a safe state or in a systemic black-out state depending on the realization of the disorder.

