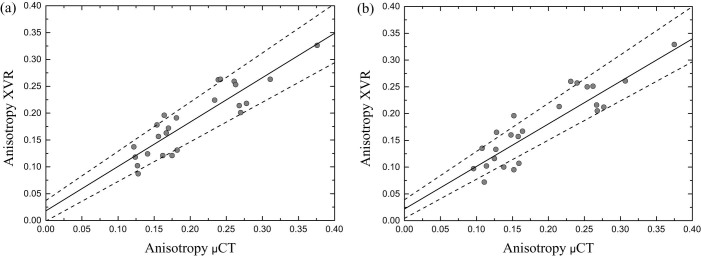
Figure 6. Mean anisotropy of XVR measurements plotted against mean anisotropy based on μCT calculations.

The area over which was averaged is indicated in figure 3(a). (a) The average anisotropy was calculated using the original XVR data with pixel size of 127 μm2 and corresponding μCT calculation. A linear fit line with coefficients a = (0.018 ± 0.019) and b = (0.826 ± 0.089) is added. (b) Rebinned XVR data corresponding to a very coarse detector pixel size of 508 μm2 was used to calculate the mean anisotropy. The parameters used in the μCT calculation was adjusted accordingly. The coefficients of the linear regression line are very similar to the original data presented in (a) with a = (0.022 ± 0.017) and b = (0.816 ± 0.085).
