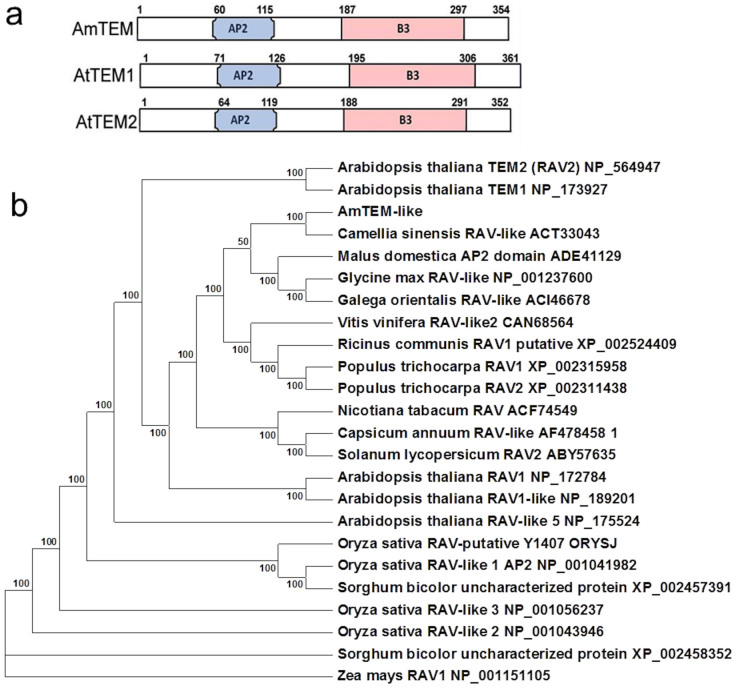
Figure 3. Relationship of RAV sub-family class I members with AmTEM.
(a) Comparison of protein domain structure in AmTEM, AtTEM1 and AtTEM2. (b) Phylogenetic analysis of the deduced amino acid sequence of AmTEM and other RAV sub-family class I member homologs. The evolutionary relationship was inferred using the Maximum Parsimony method. The percentage of parsimonious trees in which the associated taxa clustered together are shown next to the branches. Accession numbers are given next to the species name.

