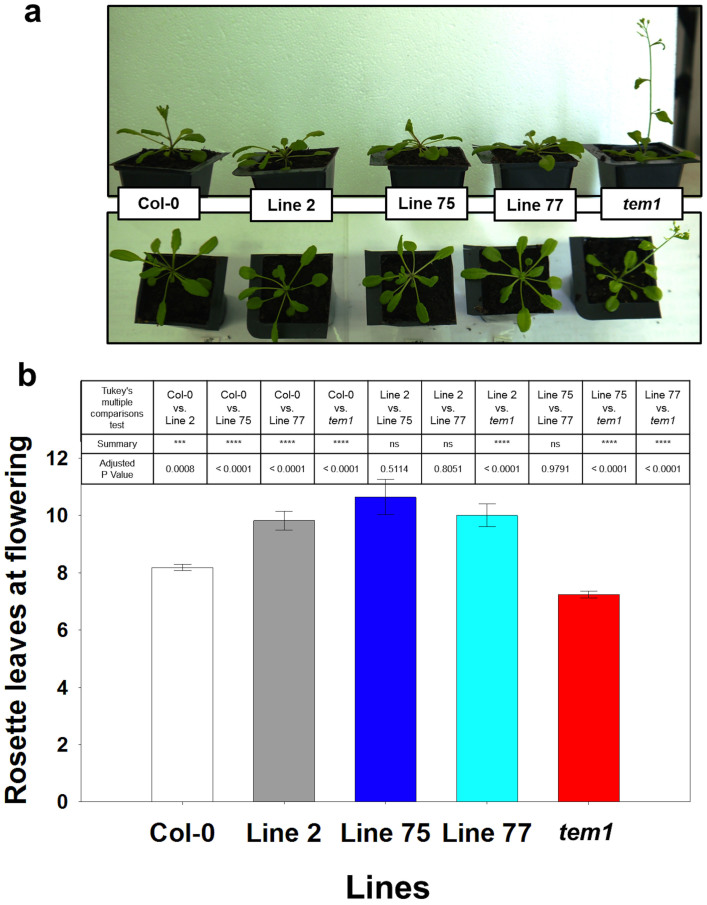
Figure 5. Phenotype of T3 generation 35S::AmTEM/tem1 line 75, line 2 and line 77 plants, the non-transformed tem1 mutant and Col-0 grown under LD conditions.
(a) Transgenic lines at 26 days from germination compared with the tem1 mutant and Col-0. (b) Number of leaves at flowering time of the transgenic lines, tem1 mutant and Col-0 plants. Data were analysed by Tukey's multiple comparisons test after two-way ANOVA (p < 0.001) (*** and **** = extremely significant; n.s = not significant). For Col-0, n = 68; for line 2, n = 11; for line 75, n = 11; for line 75, n = 14; for tem1 mutant, n = 68. Error bars represent the standard error of the mean.

