
Figure 1. Morphology of the human carotid body.
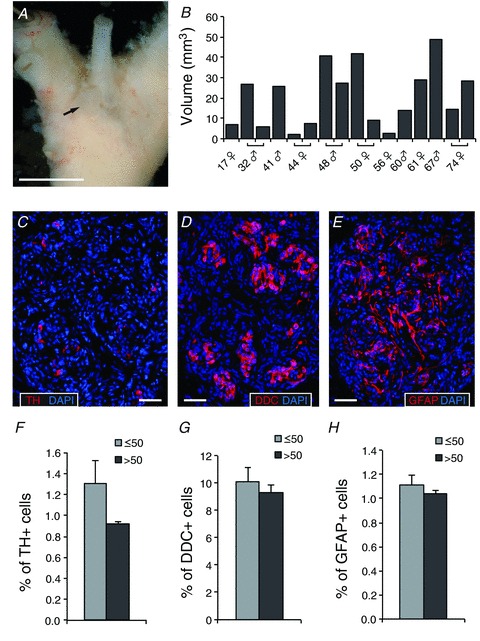
A, photograph of the human carotid artery bifurcation. Connective and adipose tissues have been removed to reveal the carotid body (indicated by a black arrow). Scale bar: 1 cm. B, volumes of human carotid bodies (in mm3) of different subjects indicating age (years), sex and location (volume of the left CB appears in the left bar of cases where both CBs have been removed from patient). Note that in some cases only one of the two CBs was dissected. C, D and E, fluorescence immunohistochemistry with antibodies against the glomus cell markers TH (C) and DDC (D), and the type II cell marker GFAP (E), in thin sections of a human carotid body. Scale bars: 50 μm. F, G and H, quantification of immunopositive cells versus total number of cells estimated in human carotid body sections. Tissues have been grouped by donor age: ≤50 years (n= 19, 15 and 24 for TH, DDC and GFAP, respectively) and >50 years (n= 10, 8 and 11, respectively). No significant changes with age were detected for any of the cell types quantified.