
Figure 4. Voltage-dependent ionic currents in human glomus cells.
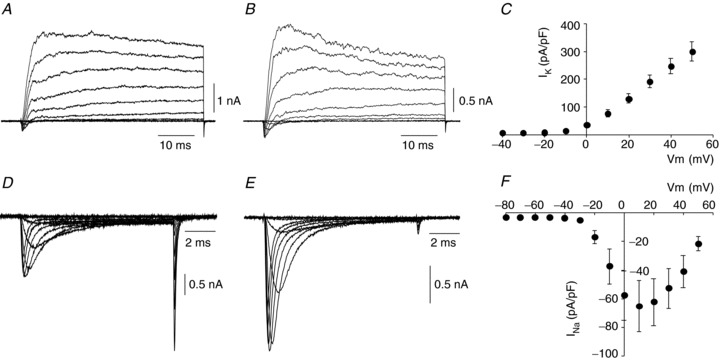
A and B, representative family of macroscopic inward and outward currents recorded in dispersed CB cells from 47- (A) and 63-year-old (B) subjects. Depolarising steps from −40 to +50 mV. Holding potential =−80 mV. C, average peak K+ current density (pA/pF) versus voltage (membrane potential, Vm) relationship obtained from human glomus cells (n= 7). Values are expressed as mean ± SEM. D and E, families of voltage-dependent Na+ and Ca2+ currents recorded in dispersed CB cells from 10- (D) and 61-year-old (E) subjects. Depolarising steps from −50 to +50 mV. Holding potential =−80 mV. Cells were dialysed with Cs+ to block outward K+ currents. Note the different proportion of Na+vs. Ca2+ currents in different cells as evidenced by the sizes of the rapidly inactivating inward currents and the tail currents at the end of the pulses. F, peak sodium current density–voltage relationship obtained in human glomus cells (n= 19). Values are expressed as mean ± SEM.