
Figure 5. Characterization of BK channel calcium sensitivity in isolated patched from BPN and BPH myocytes.
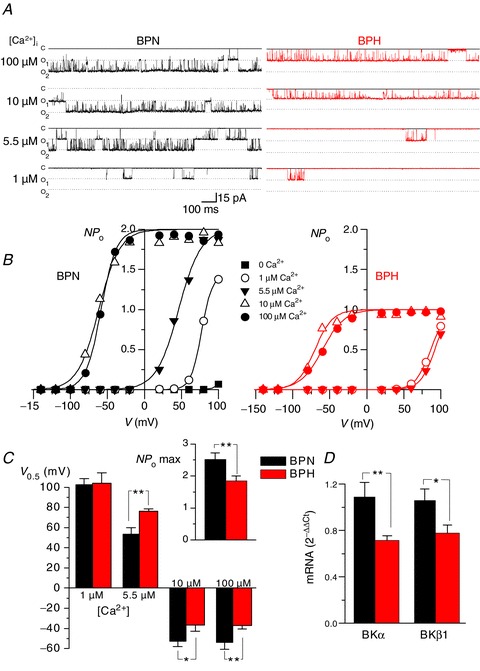
A, Ca2+ sensitivity of BK channels in inside-out patches (Holding Potential =+40 mV) from BPN (left) and BPH (right) myocytes. The figure shows representative records in the presence of different Ca2+ concentrations in the bath solution (100, 10, 5.5 and 1 μm). B, curves of channel open probability (NPo) obtained at all the different Ca2+ concentrations as a function of membrane potential were obtained from the same patches depicted in A. Solid lines represent the fit of the data to a Boltzmann function. C, the bar plot represents the mean ± SEM values of the voltage of half-maximal activation (V0.5) for BK channels at 1, 5.5, 10 and 100 μm Ca2+ as indicated. Data were obtained from the fit of the NPoversus voltage curves from six BPN and six BPH patches obtained from 5–8 different mice in each group. The inset on the right shows the mean ± SEM of the number of BK channels per patch in BPN (n= 33) and BPH (n= 31) cells, estimated from the channel count at the highest calcium concentration (maximal open probability). D, expression of mRNA for both α and β1 subunits of BK channels was obtained with real-time PCR experiments in extracts from BPN and BPH mesenteric myocytes. The levels of expression were corrected for expression of the housekeeping gene RP18S and normalized to the values in the BPN sample, which was used as calibrator. Data are mean ± SEM of triplicate determinations in four independent samples.