
Figure 6. Responses of PDGFRα+ cells to purines (ATP, ADP, β-NAD, UTP and UDP) and P2Y1 agonist MRS-2365.
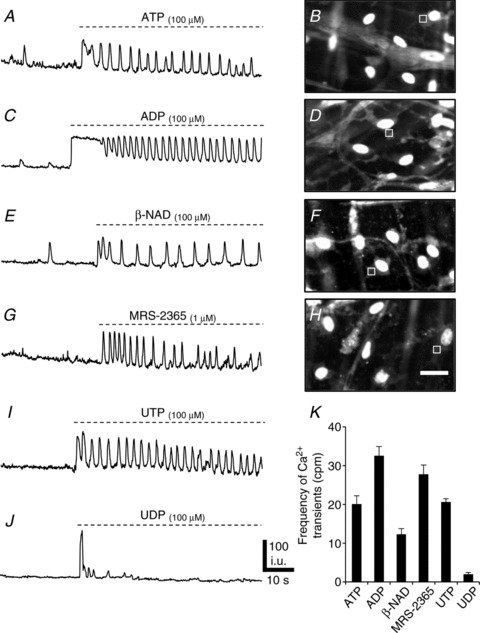
A, Ca2+ transients in an ROI (square in B) in a PDGFRα+ cell elicited by ATP (100 μm) (n= 12, c= 24; P value = 0.0001). B, image of Ca2+ transients in eGFP-PDGFRα+ (eGFP nuclei) cells in response to ATP. The Ca2+ transients were recorded in ROI denoted by the square. C, an example of Ca2+ transients in an ROI (square in D) in a PDGFRα+ cell elicited by ADP (100 μm) (n= 12, c= 24; P value = 0.0001). D, image of Ca2+ transients in eGFP-PDGFRα+ cells in response to ADP. E, Ca2+ transients elicited in a PDGFRα+ cell (ROI: square in F) by β-NAD (100 μm) (n= 12, c= 22; P value = 0.02). F, image of Ca2+ transients in eGFP-PDGFRα+ (eGFP nuclei) in response to β-NAD. G, Ca2+ transients elicited in a PDGFRα+ cell (ROI: square in H) in response to MRS-2365 (1 μm). H, image of Ca2+ transients in eGFP-PDGFRα+ in response to MRS-2365 (n= 12, c= 22; P value = 0.0001). I, Ca2+ transients elicited in a PDGFRα+ cell in response to UTP (100 μm) (n= 6, c= 14; P value = 0.0001). J, Ca2+ transients elicited in a PDGFRα+ cell in response to UDP (100 μm) (n= 5, c= 10; P value = 0.0001). K, summary of changes in the frequency of Ca2+ transients in response to purines (each bar in the graph represents the average of the frequency of Ca2+ transients in response to a given purine and the n value represents the number tissues exposed to each purine). Scale bar in H is 20 μm and pertains to B, D and F panels.