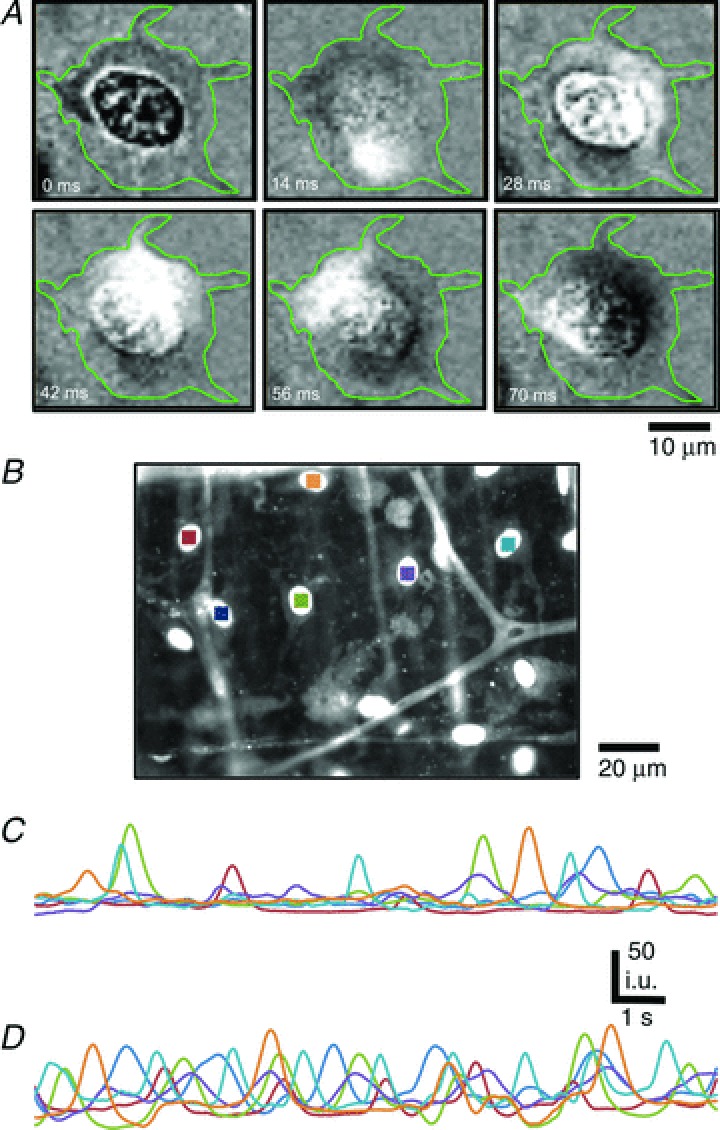
Figure 7. Asynchronous Ca2+ waves in PDGFRα+ cells.

A, representative time-sequence images of a spontaneous Ca2+ wave in a PDGFRα+ cell. The duration of the Ca2+ wave was 0.56 s. Images were background corrected and the green outlines in each image denote the cell boundary (n= 6, c= 37; scale bar is 10 μm). B-D, Ca2+ transients were monitored in PDGFRα+ cells before and after ADP. B, Ca2+ transients were recorded in arbitrary units from ROIs defined in several PDGFRα+ cells (coloured squares). Scale bar is 20 μm. C, cytosolic Ca2+ dynamics in 6 PDGFRα+ cells shown in coloured ROIs in C under control conditions and after ADP (D). Ca2+ transients were stochastic and non-propagating events in PDGFRα+ cells before and after stimulation with ADP (n= 6).
