
Figure 12. Role of ryanodine receptors in purinergic responses of PDGFRα+ cells.
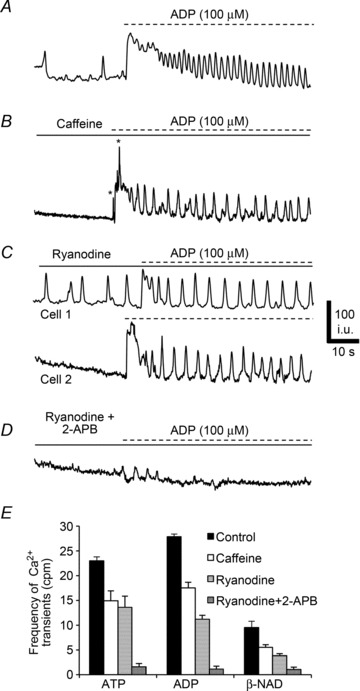
A, Ca2+ transients in PDGFRα+ cells after ADP (100 μm). All traces were recorded in the presence of l-NNA (100 μm) and atropine (1 μm). B, caffeine (10 mm) reduced the frequency of Ca2+ transients in PDGFRα+ cells elicited by ADP (n= 5, c= 12; P value = 0.001). C, ryanodine (50 μm) also reduced Ca2+ transients in PDGFRα+ cells (see Cell 1 and Cell 2; n= 5, c= 14; P value = 0.001). Some PDGFRα+ cells (e.g. Cell 1) displayed increased spontaneous Ca2+ transients in the presence of ryanodine. D, a combination of ryanodine (50 μm) and 2-APB (50 μm) blocked most of the Ca2+ transients in PDGFRα+ cells and responses to purines (n= 5, c= 12; P value = 0.001). E, summary of Ca2+ transient frequency in PDGFRα+ cells in response to purines (ATP and ADP and β-NAD, n= 15) control (black) and in the presence of caffeine (10 mm; white), ryanodine (50 μm; white with horizontal lines) and ryanodine and 2-APB together (50 μm; white cross hatched). Each bar in the graph represents the average of the frequency of Ca2+ transients in response to a given purine and the n value represents the number of tissues exposed to each purine.