
Figure 2. The effect of prior administration of anabolic steroids on the number of nuclei myonuclei per fibre found on cross-sections (CS; A) and fibre cross-sectional area (CSA; B).
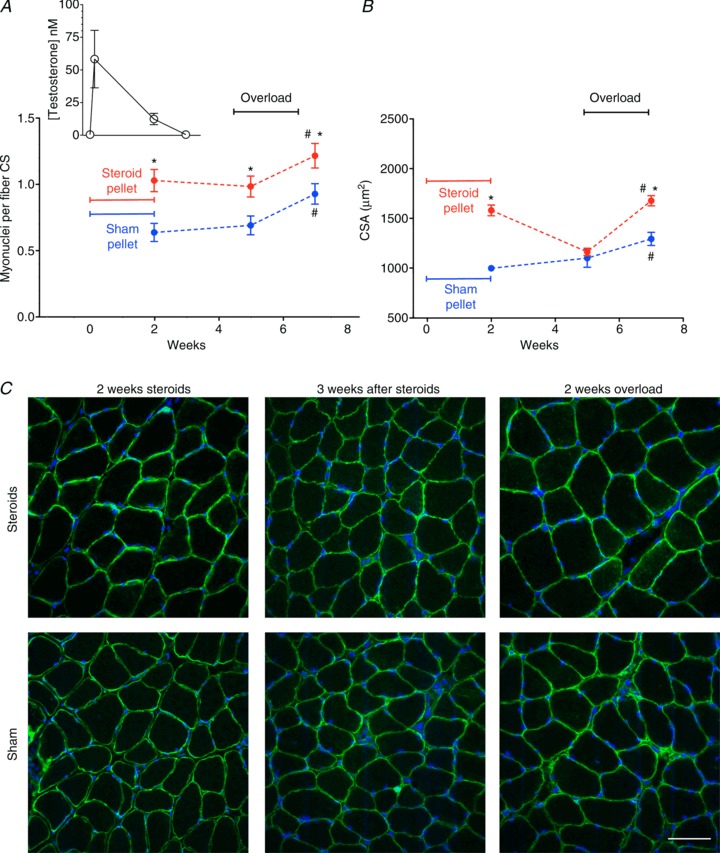
Inset in A shows blood testosterone concentration on same time axis as in main figure. *Statistically significantly different from sham (P < 0.05); #statistically significantly different from overload (P < 0.05). Each data point represents 300 fibres from 6 muscles. C, representative micrographs of cryosections stained with Hoechst dye 33342 (blue) to label DNA, and antibodies against dystrophin (green) after treatment with anabolic steroid or sham pellets for 2 weeks, 3 weeks after pellet removal, and followed by functional overload for 2 weeks. Scale bar is 50 μm.