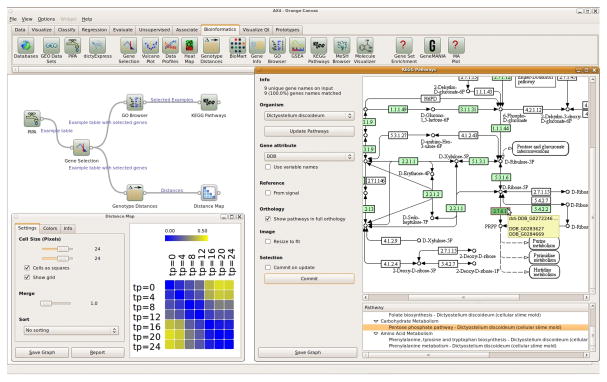
Figure 5. A typical Orange bioinformatics schema.
Wild-type Dictyostelium gene expression data from PIPA are fed to the “Gene Selection” widget. The selected genes are analyzed for term enrichment in Gene Ontology, where a subset of genes is chosen and for which a KEGG pathway is displayed. The other branch of the schema computes and displays differences between expression profiles at different stages of development.

