Figure 1.

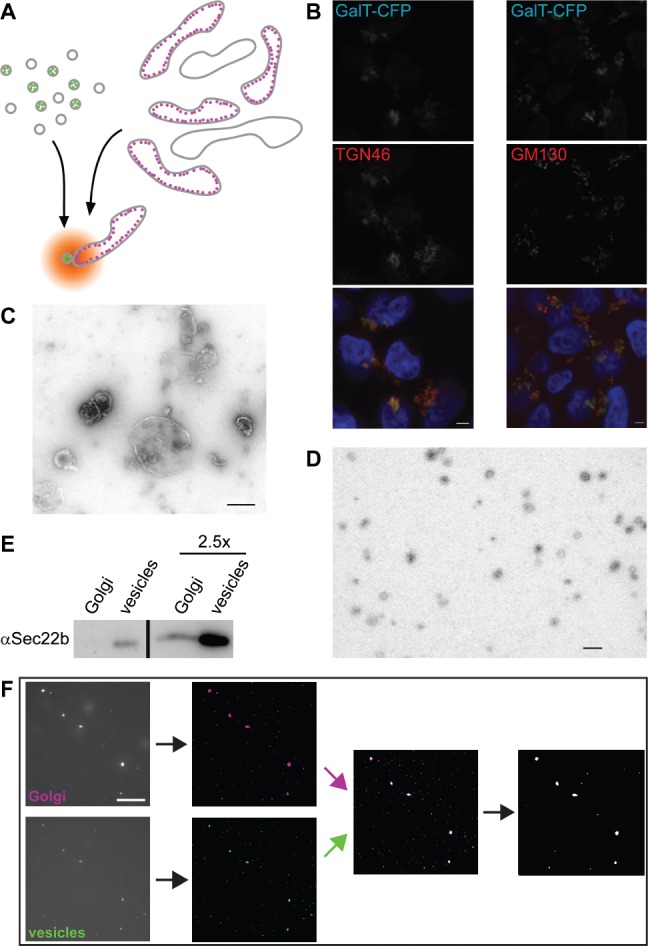
Setup of a cell-free assay using fluorescently tagged GalT as a marker. A) Schematic view of the assay in which Golgi and vesicle fractions are isolated from HEK293 cells stably expressing CFP-tagged (magenta) or YFP-tagged (green) GalT. Following their coincubation under assay conditions, colocalization is determined using fluorescence microscopy. B) Confocal fluorescent micrographs of stable GalT-CFP (green)-expressing HEK293 cells immunostained for TGN46 (left, red) or GM130 (right, red). Blue in the merge image shows DAPI staining, scale bar is 2 µm. C and D) Negatively stained electron micrographs of Golgi (C) and vesicle (D) fractions. Scale bars are 500 nm (C) and 200 nm (D). E) Immunoblot against Sec22b of equivalent Golgi and vesicle amounts. The two lanes on the right contain 2.5-fold more membrane material than the left ones. F) Typical imageJ-based data analysis workflow after image acquisition. Following noise reduction and background subtraction, binary images were overlaid and the particles containing at least one colocalizing pixel exported to be counted. For details, see Materials and Methods. Scale bar, 10 µm.
