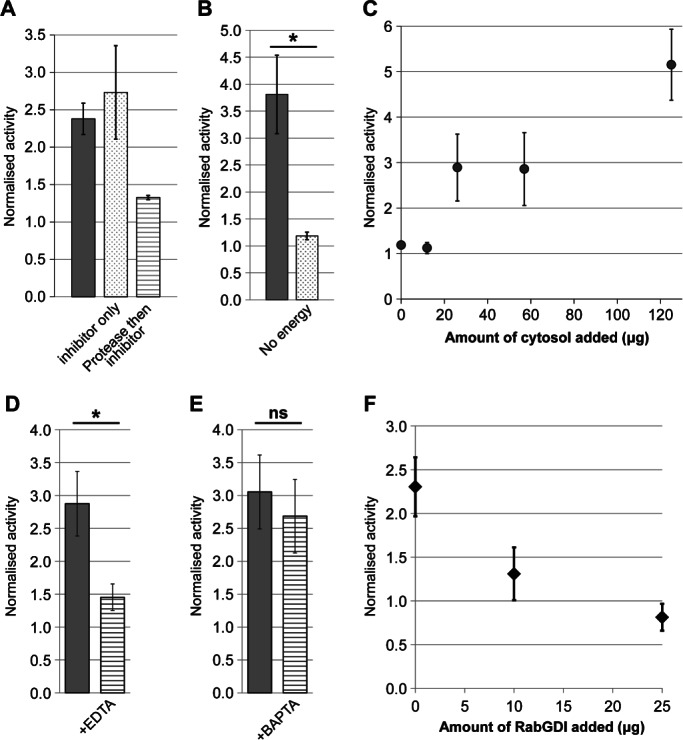
Figure 2.

Testing the assay under physiological conditions. A) Assays in the presence of membranes, cytosol and energy were performed (grey bar) in the presence of the protease inhibitor Pefabloc (dotted bar) and in the presence of Pefabloc added following a 30-min incubation on ice with Proteinase K (striped bar). Error bars show SEM for n = 2. B) Assays performed in the presence of membranes and cytosol with (grey bar) or without (dotted bar) energy source. Error bars show SEM for n = 3. C) Assay activity in the presence of increasing amount of cytosol. Error bars show SD for n = 2. Note that standard assays used 57 µg cytosol to allow the addition of other factors without increasing osmolarity beyond 310 mOsm. D and E) Activity in the presence of the chelators EDTA (D, n = 6) or BAPTA (E, n = 5). Error bars represent SEM. F) Assay activity in the presence of increasing amounts of RabGDI. Full assay mix was preincubated with the indicated amount of RabGDI for 20 min on ice before addition of the energy regeneration system and normal assay incubation. Error bars represent SEM for n = 3 (0 and 25 µg RabGDI) or n = 2 (10 µg RabGDI). Note that the value of 1.0 is the activity observed in the ice-control sample. Statistical significance was determined as described in the Materials and Methods section, *p < 0.05; ns, not significant.
