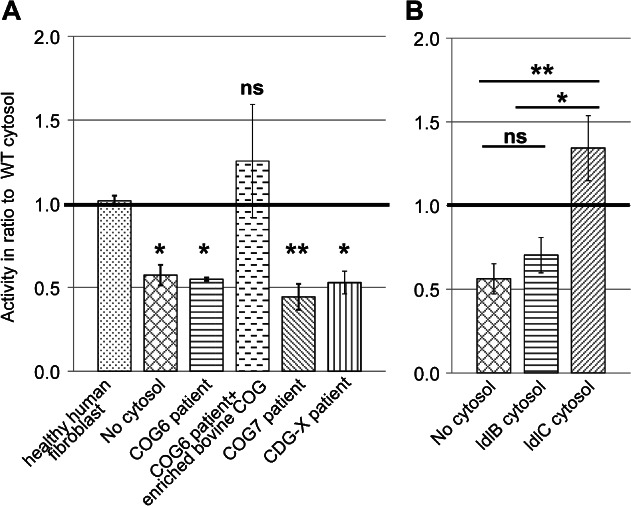
Figure 3.

Functional distinction between lobe A and lobe B of the COG complex. A) Transport activity with cytosol from fibroblasts of COG-deficient patients as well as a novel CDG-X patient with an unknown mutation. Because of differences in cytosol and membrane concentrations between different experiments the bars show the average of the ratio between the given cytosol's activity and WT cytosol activity. The value of 1.0 therefore represents WT activity in this graph. Escherichia coli cytosol was used in the control without cytosol. SEM calculated for no cytosol, COG6 and COG7 n = 4, CDG-X n = 3 and complemented COG6 and human fibroblast n = 2. See Figure S1, Supporting Information for the individual assays used for calculating the ratios for the COG7-deficient cytosol as an example. B) Transport activity in the presence of cytosol isolated from COG mutant CHO cell lines. ldlB cells (horizontal stripes) are COG1 deficient, whereas ldlC cells (slanted stripes) are COG2 deficient. All details as in ‘A’, activities are shown in ratio to WT CHO cytosol. Error bars represent SEM for n = 4. Although E. coli cytosol was used as a protein mix in ‘A’ to suppress non-specific membrane aggregation, we found that omission of this did not cause a difference, and therefore conducted some of the experiments in ‘B’ without this additive.
