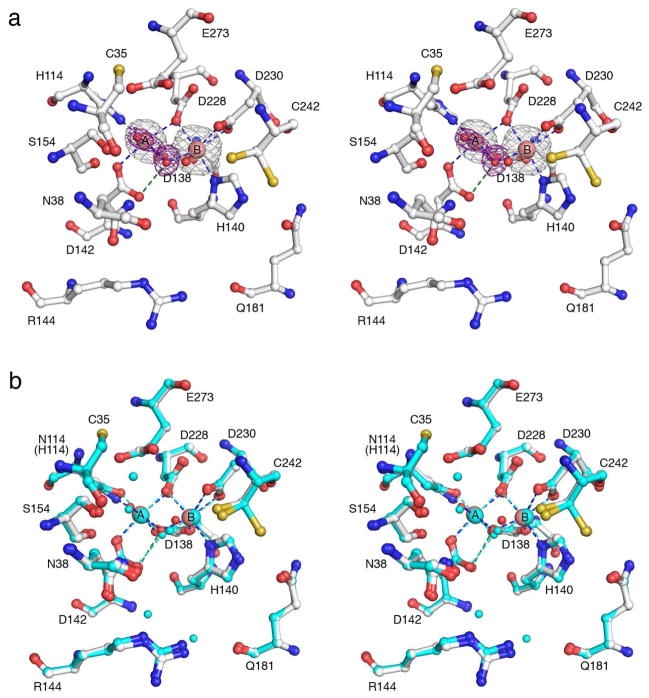
Figure 4.
(a) Simulated annealing omit maps of Mn2+ ions (grey, contoured at 3σ) and metal-bound solvent molecules (purple, contoured at 5σ) in the active site of N114H Mn2+2-TcFIGase (pH 7.5). Atoms are color-coded as follows: C = white, N = blue, O = red, Mn2+ = pink spheres, solvent = red spheres. Metal coordination and hydrogen bond interactions are represented by blue and green dashed lines, respectively. Note that the side chain thiol group of C242 is disordered between two positions. (b) Superposition of N114H Mn2+2-TcFIGase (color coded as in (a)) and wild-type Mn2+2-TcFIGase (color coded as in (a) except that C, Mn2+ = cyan).

