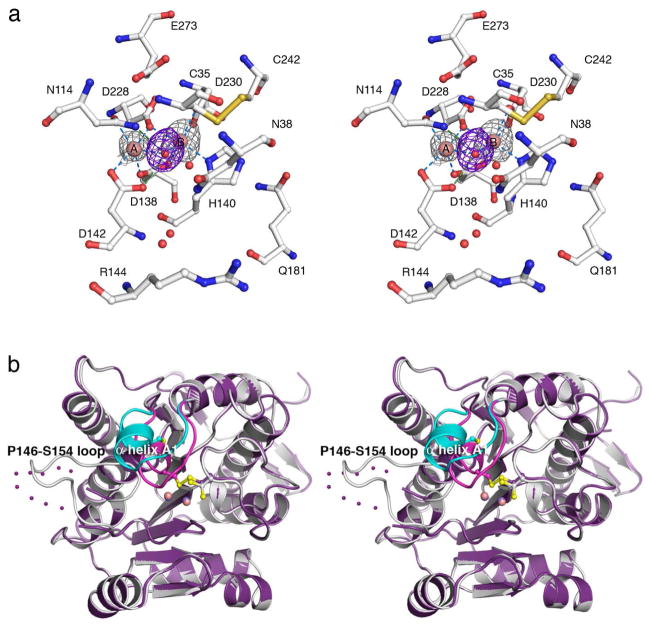
Figure 5.
(a) Bijvoet difference Fourier map (grey, contoured at 3σ) of Mn2+ ions and simulated annealing omit map (purple, contoured at 3σ) of Mn2+-bound solvent molecules in the active site of wild-type Mn2+2-TcFIGaseox (pH 6.0). Atoms are color-coded as follows: C = white, N = blue, O = red, Mn2+ = pink spheres, solvent = red spheres. Metal coordination and hydrogen bond interactions are represented by blue and green dashed lines, respectively. (b) Superposition of the Mn2+2-TcFIGaseox monomer (pH 6.0, purple) and the Mn2+2-TcFIGase monomer (white); dotted lines indicate disordered polypeptide segments. Major conformational changes occur for helix A1 (dark pink (oxidized state), cyan (reduced state)) and the P146-S154 loop in response to disulfide bond formation.

