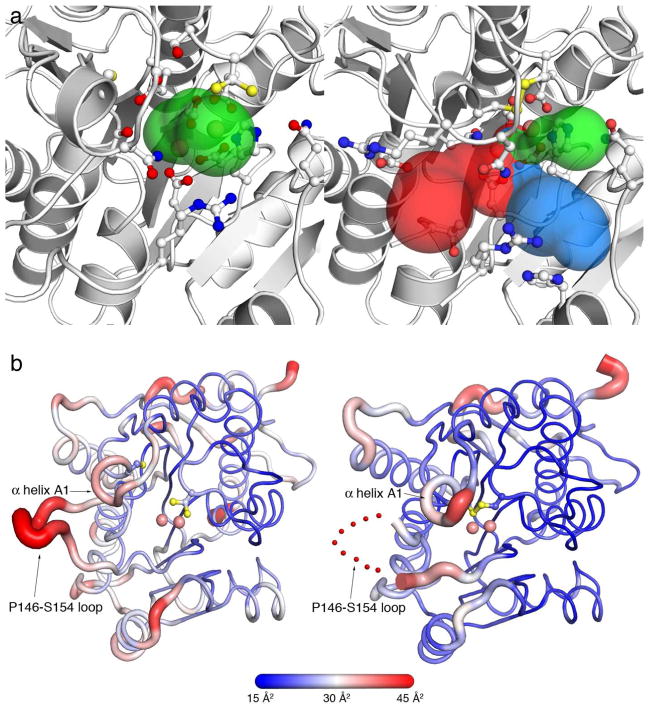
Figure 6.
(a) Structural changes in active site access triggered by disulfide bond formation in Mn2+2-TcFIGase. The original active site entrance is indicated by a green surface (left image). Following disulfide bond formation in Mn2+2-TcFIGaseox, this entrance becomes constricted and two new entrances (blue and red surfaces) become accessible (right image). Selected residues lining the entrance surface are shown as stick figures and Mn2+ ions are shown as pink spheres. Active site entrance surfaces were calculated using MOLE.43 (b) Cartoon representation of Mn2+2-TcFIGase (pH 8.0, left) and Mn2+2-TcFIGaseox (pH 8.5, right) showing the atomic displacement parameters coded by thickness of the main chain and a color gradient from blue (low disorder) to red (high disorder). The red dotted line indicates the disordered P146-S154 loop.

