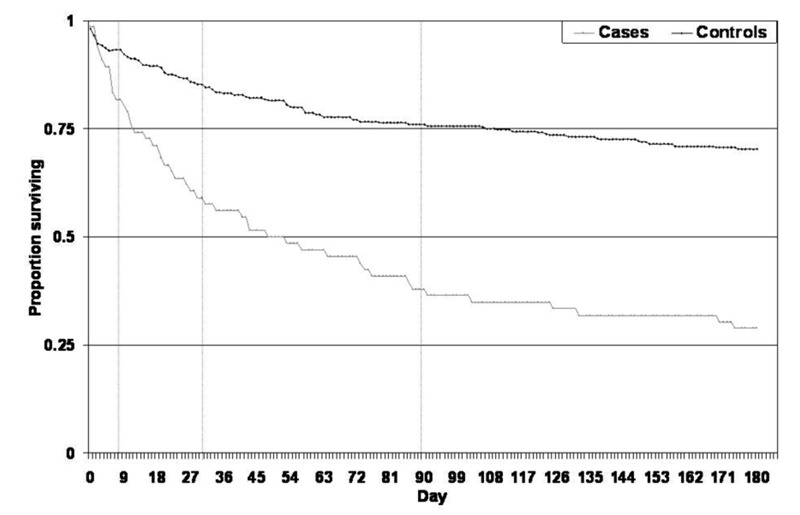
Figure 2.

Kaplan-Meier Plot of survival to 180 days for C. difficile infection cases and controls. * Calculated from day of first positive C. difficile test for cases and the time since reaching same point in admission for controls. Vertical lines are for days 7, 30 and 90.
