
Figure 6.
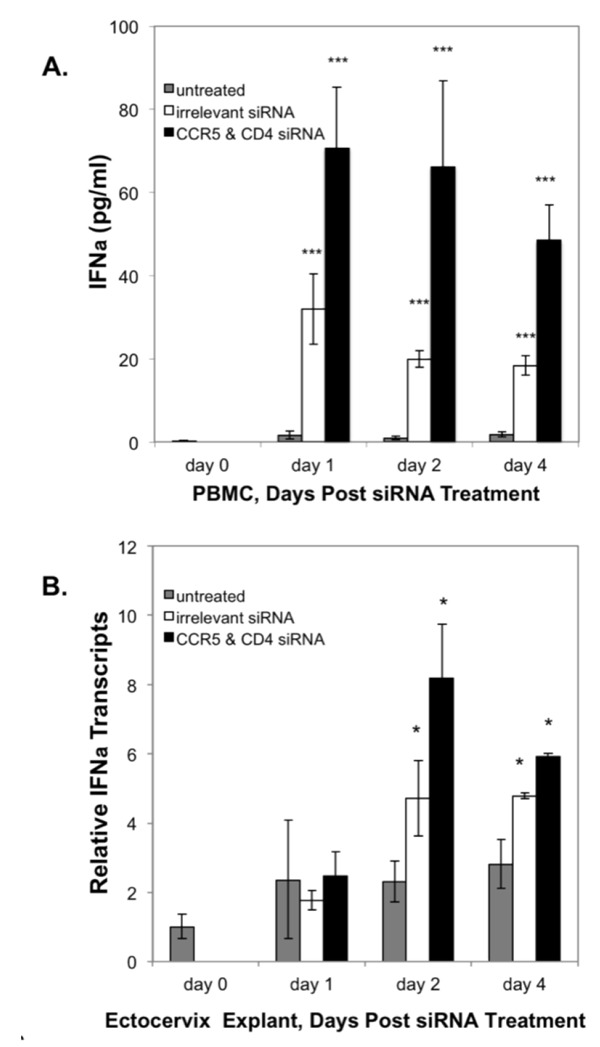
siRNA transfection upregulates IFN-α expression. A) IFN-α secreted by PBMC left untreated (grey bars) or treated with nanoparticles containing irrelevant siRNA (20 nM, white bars) or the combination of CCR5 & CD4-specific siRNA (10 nM each, black bars) were quantified at time 0, day 1, day 2, and day 4 post-transfection. Error bars show the standard deviation of the replicates. Asterisks (***) denote statistically significant differences (P<0.001) in IFN-α production between untreated and siRNA-treated PBMCs. B) siRNA stimulates IFN-α transcription in ectocervical explants. Total RNA was extracted from ECX explants on days 1, 2 and 4 either left untreated (grey bars), or after transfection with nanoparticles containing irrelevant siRNA (20 nM, white bars), or CCR5 plus CD4 specific siRNA (10 nM each, black bars). Levels are expressed as mean IFN-α transcripts relative to that observed at culture initiation (day 0). Error bars the show standard deviation of the means. Asterisks (*) denote statistically significant differences (P<0.05) between explants treated with siRNA as compared to untreated explants. Bars with no asterisk did not reach statistical significance at the 95% confidence level.