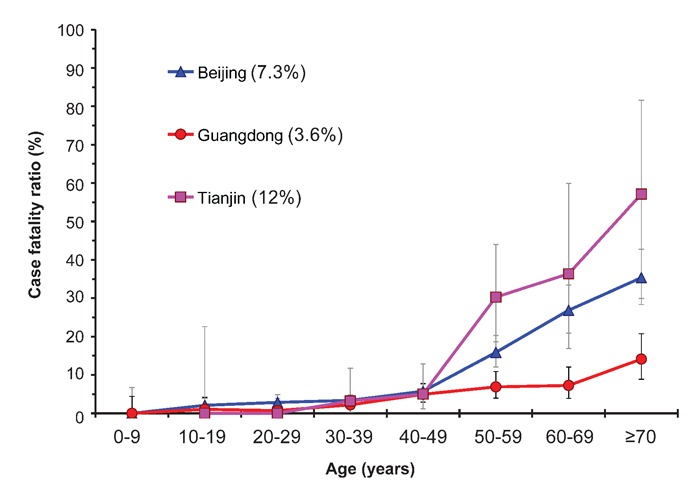
Figure 2.

Comparison of the case fatality ratios for SARS patients in Beijing, Guangdong and Tianjin with age. Intervals indicate 90% binomially distributed confidence intervals. The values between parentheses represent the overall case fatality ratio for each of the three areas.
