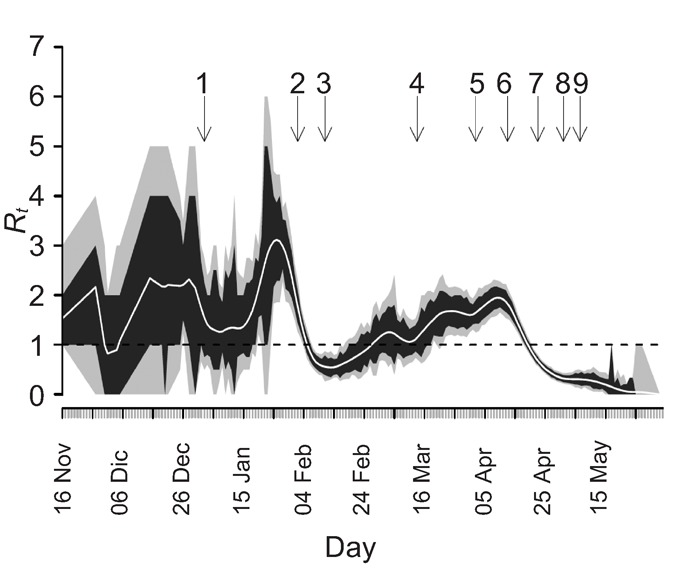
Figure 3.

Estimated effective reproduction number (Rt) (number of secondary infections generated per primary case) during the SARS epidemic in China. Values represent average Rt (central white line) and associated 95% (grey) and 80% (black) confidence intervals, by date of symptom onset. The critical value of Rt=1, below which sustained transmission is impossible, is marked with a broken horizontal line. Arrows reflect the moment of important events and public health control measures: (1) Local newspaper report about outbreak of unknown infectious disease in Guangdong (2 January); (2) Start of control in Guangdong hospitals: e.g. isolation, contact tracing (1–3 February); (3) First official report of outbreak by Guangdong authorities (11 February); (4) WHO global alerts; first mentioning of SARS (12–15 March); (5) First protocol of SARS control; start isolation in Beijing hospitals (2 April); (6) Full control under central guidance by the Chinese authorities, including mandatory reporting of SARS; definition of diagnostic criteria and treatment (11–14 April); (7) Stringent control measures: quarantine in airports and stations; closure of schools, universities and public places; daily reporting by the national media (19–26 April); (8) Public holiday cancelled; new 1000-bed SARS hospital opened (1 May); (9) Further improvement of various guidelines and protocols (4–9 May).
