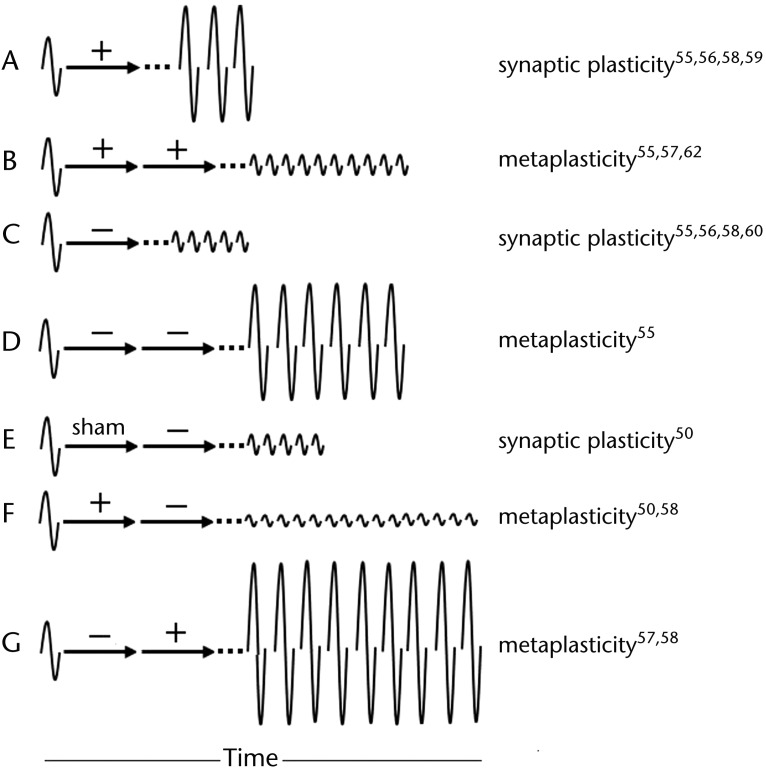
Figure 4.
Depiction of synaptic plasticity versus metaplasticity. Arrows represent conditioning. When 2 arrows are shown, the first is termed “priming.” Baseline excitability represented by amplitude of motor-evoked potential (MEP) to left of arrows. Aftereffects of conditioning represented by MEPs to right of arrows. Dotted lines reflect that aftereffects are not immediate. Illustration A shows normal aftereffects of increased excitability, compared with baseline, following facilitatory (+) conditioning, amounting to synaptic plasticity. Illustration B, however, shows aftereffects of decreased excitability even though both priming and conditioning were facilitatory. This alteration from normal response represents metaplasticity. Illustration C shows normal aftereffects of decreased excitability following depressive (−) conditioning. In contrast, illustration D shows opposite aftereffects when depressive priming precedes depressive conditioning. Illustration E shows normal aftereffects of decreased excitability following sham priming of depressive conditioning (identical to illustration C). Importantly, illustration F shows accentuation of aftereffects (ie, greater depression and longer duration compared with illustration E) following same depressive conditioning but preceded by opposite priming. Similarly, illustration G shows accentuated excitability aftereffects (compared with illustration A) following facilitatory conditioning but preceded by opposite priming.

