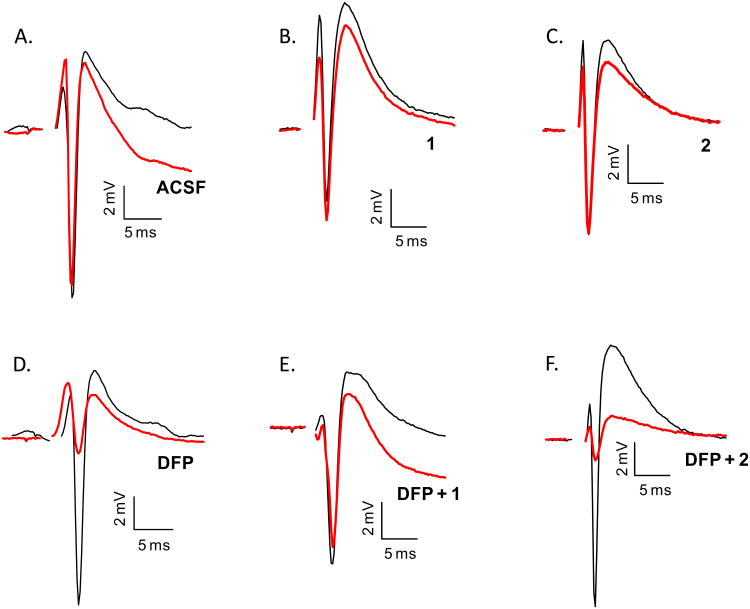
Figure 3.
Representative population spikes recorded after various treatments. Initial PSs (black line) were recorded one-hour after dissection and final PSs (red line) were recorded after treatment as illustrated in Figure 2. A. Initial and final PS for a slice exposed to ACSF for two hours. B. PSs recorded from a slice exposed to 10 μM 1 for 60 min. C. Slice exposed to 10 μM 2 for 60 min. D. PSs recorded from a slice exposed to 100 μM DFP for 10 min. E. PSs recorded from a slice exposed to 100 μM DFP for 10 min followed by a 30 min washout with ACSF and incubation with 10 μM 1 for 60 min. F. Slice exposed to 100 μM DFP for 10 min followed by a 30 min washout with ACSF and incubation with 10 μM 2 for 60 min. Scale bars: vertical, 2 mV; horizontal, 5 ms.

