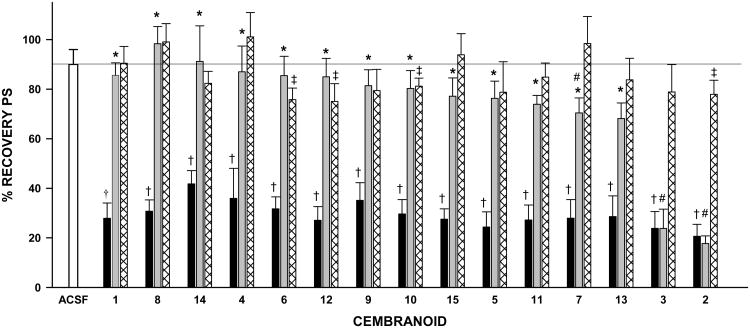
Figure 4.
Neuroprotection by cembranoids. The bars represent the mean±SEM of the % recovery of PSs for the ACSF control group (white bar), DFP control group (black bars), Cembranoid protective activity group (gray bars), and Cembranoid toxicity controls (hatched bars) (see Figure 2 for description of groups). The horizontal black line indicates 90% recovery due to rundown of the slice.†: p<0.001 for the difference between the % recovery for DFP control and 90% recovery, and ‡: p<0.05 for the difference between cembranoid alone and 90% recovery (One-Sample t-test). *: p<0.01 for the difference between DFP control and DFP followed by the cembranoid, and #: p<0.05 for the difference between DFP followed by the cembranoid and cembranoid alone (one-way-ANOVA followed by Student-Newman-Keuls test). There were two replicate experiments for each analogue, resulting in 14 values per group; three replicates were done for 1 resulting in 21 values per group.

