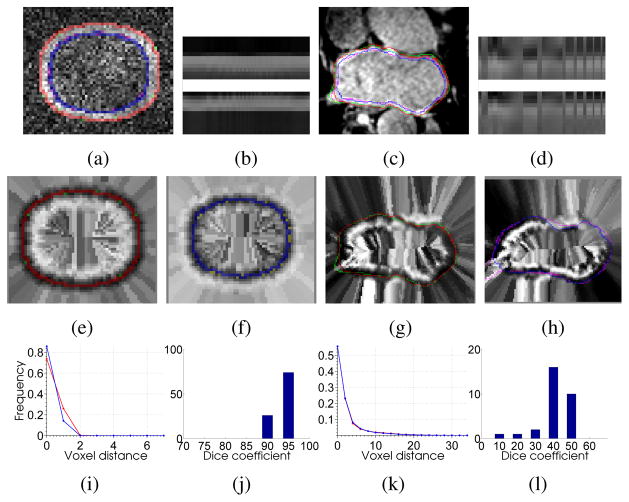
Fig. 2.
(a),(c) Results of our algorithm on simulated and LA images (red and green curves represent outer boundaries extracted by our algorithm and ground truth, blue and purple curves represent inner boundaries extracted by our algorithm and ground truth) (b),(d) intensity profiles for outer/epicardium and inner/endocardium surfaces. (e),(g) our algorithm results and ground truth boundaries overlaid on outer and epicardial cost function images. (f),(h) our algorithm results and ground truth boundaries overlaid on inner and endocardial cost function images. (i),(k) distance histogram plot (in mm) between the surfaces extracted by our algorithm and ground truth over all images for both surfaces. (j),(l) histogram of dice co-efficients for the middle region/myocardium to represent the number of images against the percentage overlap.

