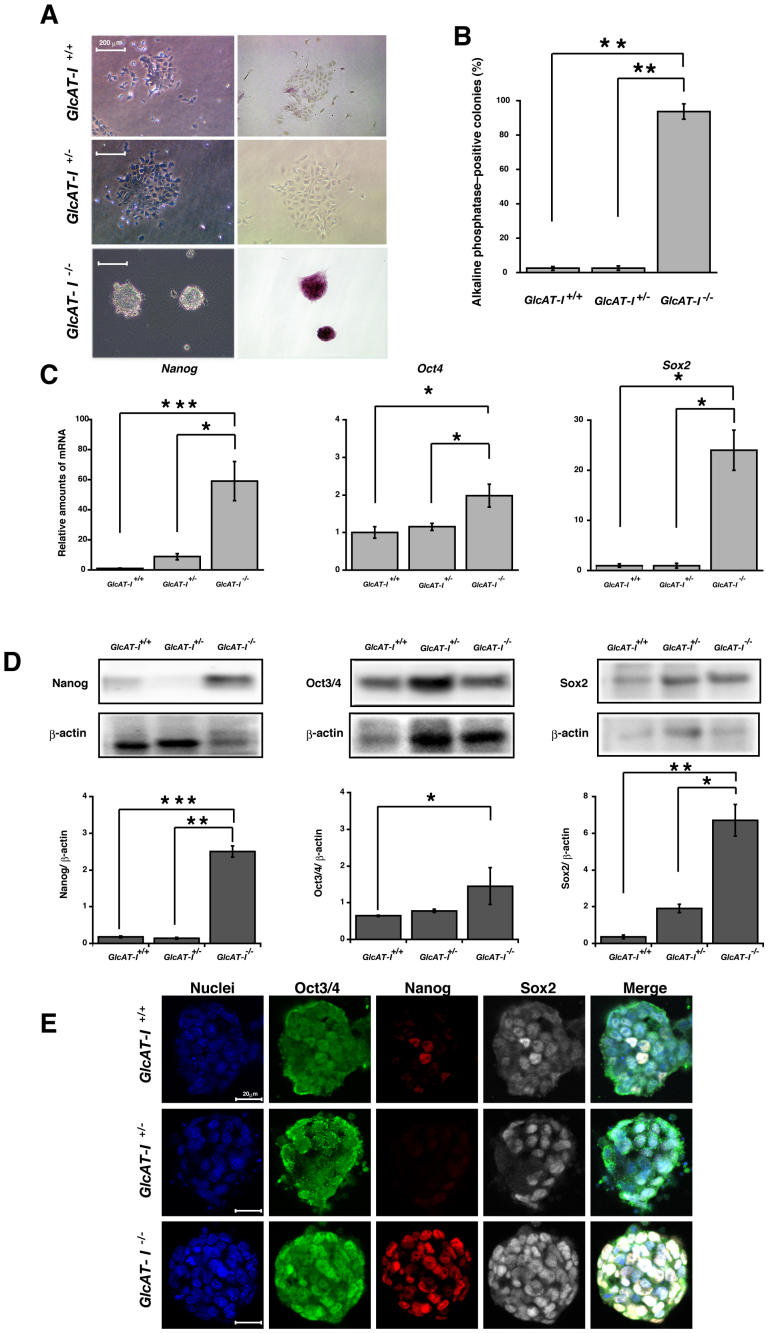
Figure 2. GlcAT-I−/− ESCs retained expression of pluripotency genes and high pluripotency.
(A), GlcAT-I+/+, GlcAT-I+/−, and GlcAT-I−/− ESCs were plated at clonal density, cultured in the absence of LIF for 5 d, and stained for alkaline phosphatase. (B), The percentage of undifferentiated colonies was examined with alkaline phosphatase assays. Error bars indicate the S.E. for triplicates of the same experiment, which is representative of at least three independent experiments. **P < 0.005, GlcAT-I+/+ versus GlcAT-I−/− ES cells, and GlcAT-I+/− versus GlcAT-I−/− ES cells. (C), Real-time PCR results of pluripotency marker genes in ESCs cultured in the absence of LIF. GAPDH transcripts were used as an internal control. *P < 0.01, expression of Nanog in GlcAT-I+/− versus GlcAT-I−/− ES cells, expression of Oct3 in GlcAT-I+/+ or GlcAT-I+/− versus GlcAT-I−/− ES cells, expression of Sox2 in GlcAT-I+/+ or GlcAT-I+/− versus GlcAT-I−/− ES cells, and ***P < 0.001, expression of Nanog in GlcAT-I+/+ versus GlcAT-I−/− ES cells. (D), Western blot and quantitative analysis of pluripotency markers, Nanog, Oct3/4, and Sox2 in ESCs cultured in the absence of LIF. β-actin was used as a loading control. The gels have been run under the same experimental condition. The blot image was cropped around the region of interest. The results are representative of at least three independent experiments. Statistical analysis was carried out by Student's t test. *P < 0.01, **P < 0.005 and ***P < 0.001. (E), The expression of pluripotency markers (Oct3/4 (green), Nanog (red), Sox2 (gray)) on GlcAT-I+/+, GlcAT-I+/−, and GlcAT-I−/− ESCs. The immunofluorescence images show that GlcAT-I−/− ESCs retained expression of pluripotency markers (Oct3/4, Nanog and Sox2) in the absence of LIF. Nuclei were visualized with DAPI staining (blue).

