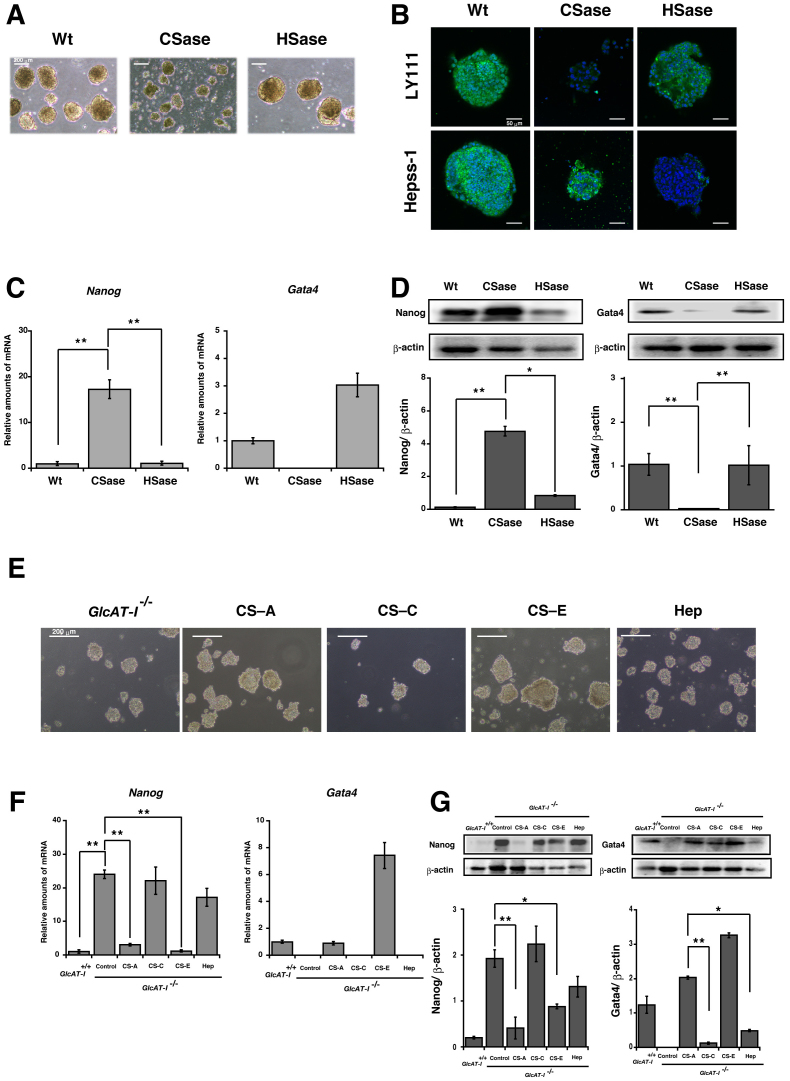
Figure 4. Sulfation pattern of CS regulates EB differentiation.
(A), Phase-contrast microscopy of day 6 Wt EBs following the addition of chondroitinase ABC (CSase) or heparitinase/heparinase (HSase) from day 0 onwards. (B), Immunofluorescence images for CS and HS chains of EB digested by continuous CSase and HSase treatment. Effective CS or HS digestion was confirmed by staining with the anti-CS antibody (LY111) (green) or anti-HS antibody (Hepss-1) (green), respectively. Nuclei were visualized with DAPI staining (blue). (C), Real-time PCR results of Nanog, the pluripotency gene, and Gata4, the differentiation marker gene, from day 6 EBs. GAPDH transcripts were used as an internal control. **P < 0.005, untreated GlcAT-I+/+ versus GlcAT-I+/+ ES cells treated with CSase, and GlcAT-I+/+ ES cells treated with CSase versus GlcAT-I+/+ ES cells treated with HSase. (D), Western blot and quantitative analysis of the pluripotency marker, Nanog, and the differentiation marker, Gata4 from day 6 EBs. β-actin was used as a loading control. The gels have been run under the same experimental condition. The blot image was cropped around the region of interest. The results are representative of at least three independent experiments. Statistical analysis was carried out by Student's t test. *P < 0.01 and **P < 0.005. (E), Phase-contrast images of day 6 GlcAT-I−/− EBs following addition of 10 μg/ml CS-A, CS-C, CS-E, or Hep from day 0 onwards. F, RT-PCR and G, western blot results of Nanog and Gata4 from EBs cultured with GAGs at day 6. The gels have been run under the same experimental condition. The blot image was cropped around the region of interest. The results are representative of at least three independent experiments. Statistical analysis was carried out by Student's t test. *P < 0.01 and **P < 0.005.

