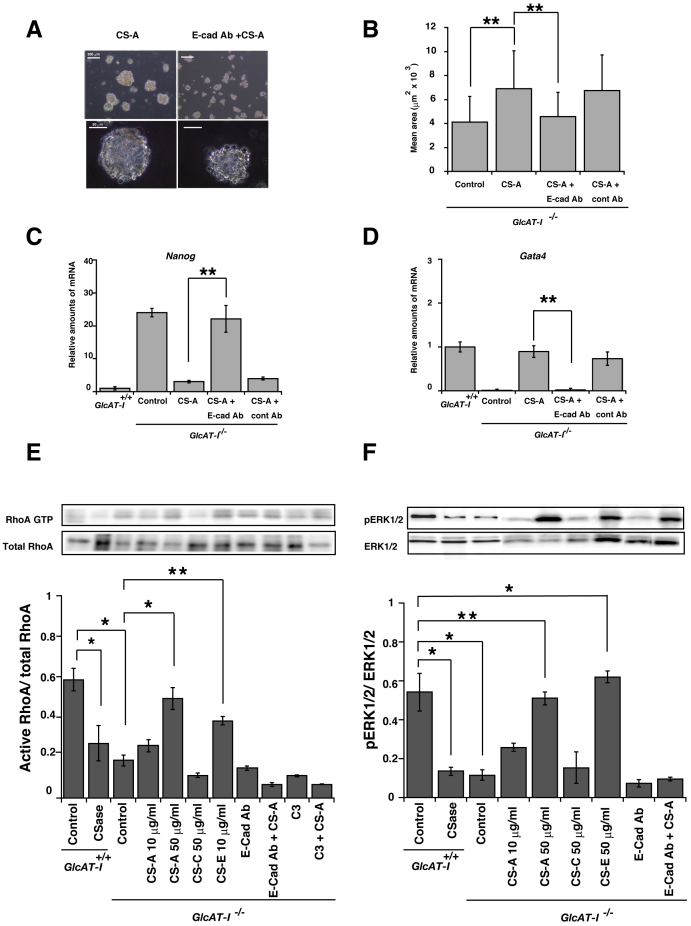
Figure 6. CS-A and CS-E modulate E-cadherin-mediated intracellular signaling.
Wild-type ESCs were treated with or without CSase and cultured. GlcAT-I−/− ESCs were treated with CS-A polysaccharide (CS-A), CS-E polysaccharide (CS-E), CS-C polysaccharide (CS-C), anti-E-cadherin antibody (E-Cad Ab), control IgG2b antibody (cont Ab), or RhoA inhibitor (C3). In addition, GlcAT-I−/− ESCs were treated with anti-E-cadherin antibody, control IgG2b antibody, or C3 for 1 h, followed by addition of CS-A polysaccharide. A, Phase-contrast microscopy of day 4 EBs. Lower panels show high-magnification images of the EBs. B, Size analysis of EBs. The results revealed that the mean area of EBs, compared with that of the control group, was larger in the CS-A group and was smaller in the CS-A with E-cad antibody. Statistical analysis was carried out by Student's t test. **P < 0.005. C and D, Real-time PCR results for a pluripotency gene, Nanog, or a differentiation marker, GATA4, during in vitro differentiation of ESCs. GAPDH transcripts were used as an internal control. Each bar represents the mean (±S.E.) values of three independent experiments. **P < 0.05, GlcAT-I−/− ES cells treated with CS-A versus GlcAT-I−/− treated with both CS-A and anti-E-cadherin antibody. Proteins were extracted from cells and analyzed with immunoblotting with anti-RhoA antibody in E, or anti-ERK1/2 and anti-phospho-ERK1/2 antibodies in F. The gels have been run under the same experimental condition. The blot image was cropped around the region of interest. The results are representative of at least three independent experiments. Each bar represents the mean (±S.E.) values of three independent experiments. E, *P < 0.01, Wt versus Wt ES cells treated with CSase, Wt versus GlcAT-I−/− ES cells, GlcAT-I−/− versus GlcAT-I−/− ES cells treated with CS-A (50 μg/ml), GlcAT-I−/− versus GlcAT-I−/− ES cells treated with CS-E (10 μg/ml), and **P < 0.005, GlcAT-I−/− versus GlcAT-I−/− ES cells treated with CS-E. F, *P < 0.01, Wt versus GlcAT-I−/− ES cells, GlcAT-I−/− versus GlcAT-I−/− ES cells treated with CS-E (10 μg/ml), and **P < 0.005 GlcAT-I−/− versus GlcAT-I−/− ES cells treated with CS-A (50 μg/ml).

