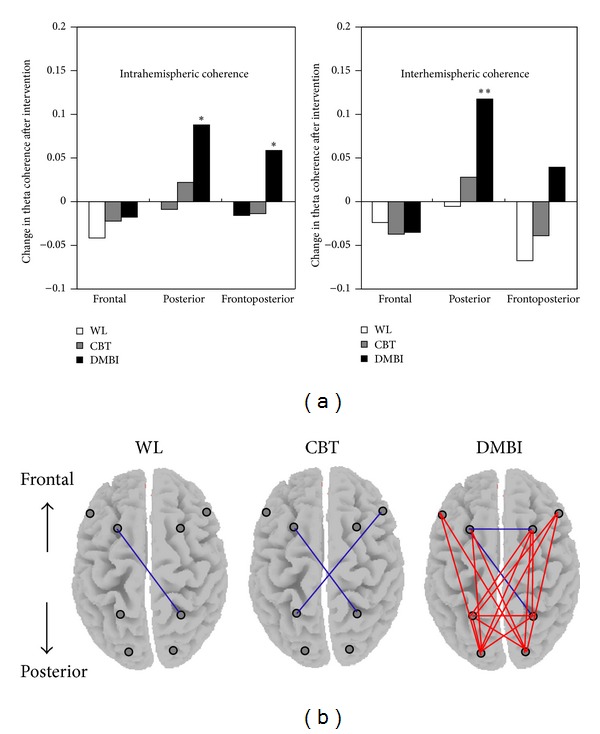
Figure 3.

Changes in intra- and interhemispheric theta coherence after intervention across three groups. (a) The bar chart shows the mean difference in theta coherence indices between baseline and postintervention of each group. Positive values indicate increased level of theta coherence after intervention; negative values indicate a reduction in coherence analyzed with paired samples Student's t-test; **P < 0.01; *P < 0.05. (b) The topographic map indicates the individual electrode pairs that yield significant changes in theta coherence of each group after intervention. Red lines linking the electrode pairs signify significant coherence increments, whereas blue lines indicate significant coherence decrements analyzed with paired samples Student's t-test, P ≤ 0.05. WL = waitlist group; CBT = cognitive behavioral therapy group; DMBI = Dejian mind-body intervention group.
