
Figure 4.
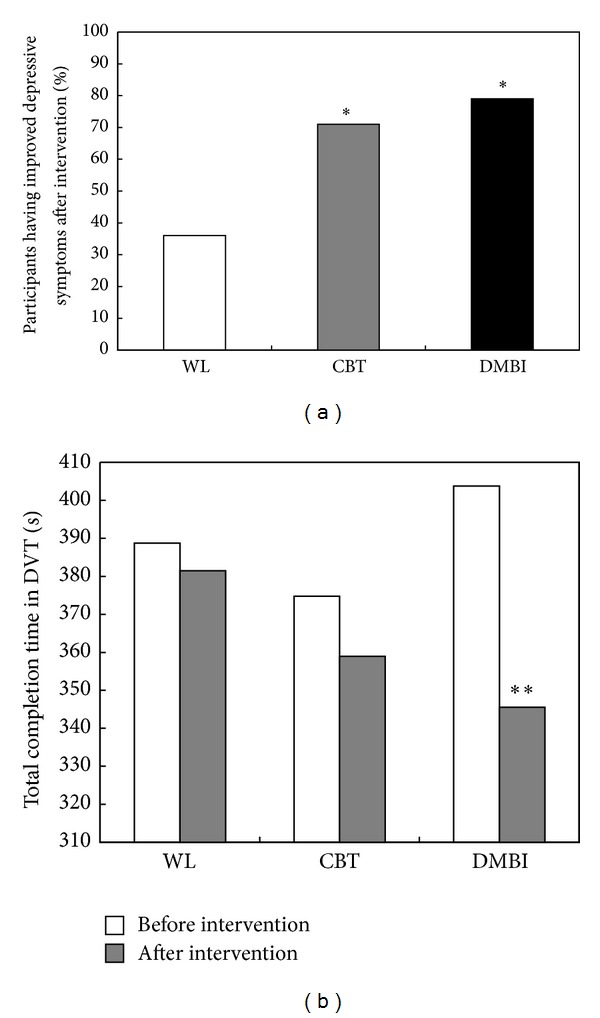
Difference in measures of depressive symptoms and attentional ability at baseline and after 10-week training for waitlist, CBT, and DMBI groups. (a) Each bar represents the percentage of participants in each group having reduced depressive symptoms as indicated by their shift to a less severe clinical classification as measured with the Beck Depression Inventory (BDI-II). (b) The ordinate represents the total completion time of the Digit Vigilance Test (DVT), where shorter completion time indicates greater work efficiency and increased ability to maintain attention on the task. *P < 0.05 (Chi-squared test or paired Student's samples t-test).