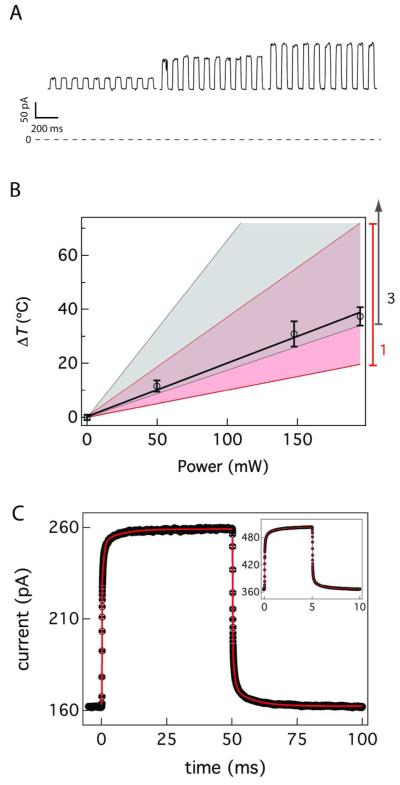
Figure 2.
Control and measurement of the temperature in and around the nanopore. (A) Conductance changes of a single nanopore caused by laser excitation of 40 nm diameter gold nanoparticles. The applied voltage was 40 mV and the on/off chopping frequency is 10 Hz. The detection bandwidth and sampling frequency are 10 kHz and 50 kHz respectively. For the highest power setting a second nanopore with an identical conductance appeared, and the current from that part of the data was divided by two. The slow variation in conductance in the heated states is likely caused by the movement of the system in the laser beam profile. (B) Estimated temperature change with the applied laser power. The pink shaded region shows the calculated heating with on SD error estimate for a single nanoparticle attachment and the grey shaded region shows the three particle heating calculation and error estimate (see text). (C) 390 currents steps were aligned and averaged. These data were fit a sigmoidal function in series with an exponential function (red solid line, see SI for details) to yield two time constants. The excitation power was 147.5 mW and the ionic current was sampled at 50 kHz after filtering the data with a 10 kHz 4-pole low pass Bessel filter (inset). 3,000 current steps of two nanopores were aligned and averaged to improve the signal to noise ratio and then fit to three time constants from a sigmoidal function in series with two exponential functions (red solid line). The excitation power was 180 mW, and the ionic current was sampled at 250 kHz after filtering the data with a 100 kHz 4-pole low pass Bessel filter.

