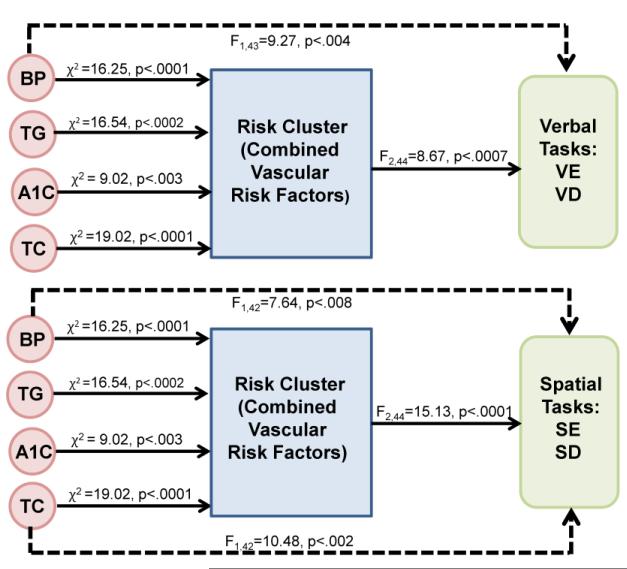
Fig. 5.
Path Analysis. Effects of Risk Cluster groups on verbal and spatial task accuracy along with independent and simultaneous effects of risk factors on task accuracy. These 4 risk factors (systolic blood pressure or BP, triglycerides or TG, total cholesterol or TC, and A1C) were entered into a path analysis based on Table 2 results. Solid lines at right of figure represent how well the Risk Cluster groups (combined risk factors for groups 1–3) predict performance on the verbal and spatial working memory tasks. Dashed lines represent how well the 4 risk factors independently predict performance on the verbal and spatial working memory tasks when Risk Cluster was in the model. Solid lines to the left of the Risk Cluster reflect results from a logistic regression (cumulative logit model) representing the 3 Risk Clusters.

